## Chart: Final-round Accuracy and LLM GT Information Gain vs. Avg. Bayesian GT Information Gain
### Overview
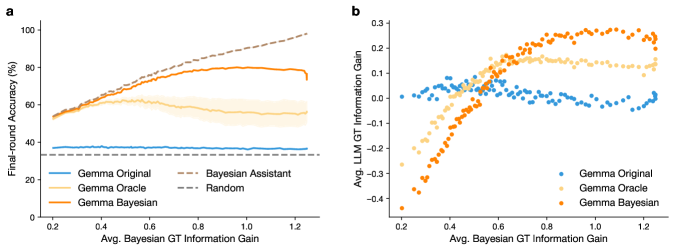
The image presents two charts (a and b) comparing the performance of different models (Gemma Original, Gemma Oracle, Gemma Bayesian, Bayesian Assistant, and Random) based on their final-round accuracy and average LLM GT information gain relative to the average Bayesian GT information gain. Chart 'a' shows the final-round accuracy as a function of the average Bayesian GT information gain, while chart 'b' shows the average LLM GT information gain as a function of the average Bayesian GT information gain.
### Components/Axes
**Chart a:**
* **Title:** Final-round Accuracy vs. Avg. Bayesian GT Information Gain
* **X-axis:** Avg. Bayesian GT Information Gain, ranging from 0.2 to 1.2.
* **Y-axis:** Final-round Accuracy (%), ranging from 0 to 100.
* **Legend (bottom-left):**
* Blue line: Gemma Original
* Light Orange line: Gemma Oracle
* Orange line: Gemma Bayesian
* Dashed brown line: Bayesian Assistant
* Dashed gray line: Random
**Chart b:**
* **Title:** Avg. LLM GT Information Gain vs. Avg. Bayesian GT Information Gain
* **X-axis:** Avg. Bayesian GT Information Gain, ranging from 0.2 to 1.2.
* **Y-axis:** Avg. LLM GT Information Gain, ranging from -0.4 to 0.3.
* **Legend (bottom-right):**
* Blue dots: Gemma Original
* Light Orange dots: Gemma Oracle
* Orange dots: Gemma Bayesian
### Detailed Analysis
**Chart a:**
* **Gemma Original (Blue):** The accuracy remains relatively constant at approximately 35% across the range of Avg. Bayesian GT Information Gain.
* **Gemma Oracle (Light Orange):** The accuracy starts at around 55% at 0.2 Avg. Bayesian GT Information Gain, increases to approximately 65% around 0.6, and then decreases to around 55% at 1.2. There is a shaded region around this line, indicating variability or confidence intervals.
* **Gemma Bayesian (Orange):** The accuracy starts at around 55% at 0.2 Avg. Bayesian GT Information Gain, increases to approximately 80% around 0.8, and then decreases slightly to around 78% at 1.2.
* **Bayesian Assistant (Dashed Brown):** The accuracy increases from approximately 60% at 0.2 Avg. Bayesian GT Information Gain to approximately 95% at 1.2.
* **Random (Dashed Gray):** The accuracy remains constant at approximately 35% across the range of Avg. Bayesian GT Information Gain.
**Chart b:**
* **Gemma Original (Blue):** The Avg. LLM GT Information Gain starts at approximately 0.1 at 0.2 Avg. Bayesian GT Information Gain, decreases to approximately -0.1 at 0.6, and then increases to approximately 0.0 at 1.2.
* **Gemma Oracle (Light Orange):** The Avg. LLM GT Information Gain starts at approximately -0.3 at 0.2 Avg. Bayesian GT Information Gain, increases to approximately 0.2 at 0.8, and then decreases to approximately 0.0 at 1.2.
* **Gemma Bayesian (Orange):** The Avg. LLM GT Information Gain starts at approximately -0.4 at 0.2 Avg. Bayesian GT Information Gain, increases to approximately 0.3 at 0.8, and then decreases to approximately 0.0 at 1.2.
### Key Observations
* In chart a, the Bayesian Assistant consistently outperforms the other models in terms of final-round accuracy as the Avg. Bayesian GT Information Gain increases. Gemma Bayesian also shows a significant improvement in accuracy with increasing information gain, while Gemma Original and Random remain relatively constant.
* In chart b, Gemma Bayesian and Gemma Oracle show a similar trend of increasing Avg. LLM GT Information Gain up to a certain point (around 0.8 Avg. Bayesian GT Information Gain) and then decreasing. Gemma Original shows a less pronounced variation.
### Interpretation
The charts suggest that leveraging Bayesian GT information gain can significantly improve the performance of certain models, particularly the Bayesian Assistant and Gemma Bayesian, in terms of final-round accuracy. However, the relationship between Avg. Bayesian GT Information Gain and Avg. LLM GT Information Gain is more complex, with the models showing an initial increase in LLM GT Information Gain followed by a decrease as the Bayesian GT Information Gain increases beyond a certain point. This could indicate a saturation effect or a change in the way the models utilize the information gain at higher levels. The Gemma Original model appears to be less sensitive to the Bayesian GT Information Gain in both accuracy and LLM GT Information Gain. The Random model performs as expected, with a constant low accuracy, indicating that the Bayesian GT Information Gain is not being effectively utilized in this case.