\n
## Charts: Performance Comparison of LLM Models
### Overview
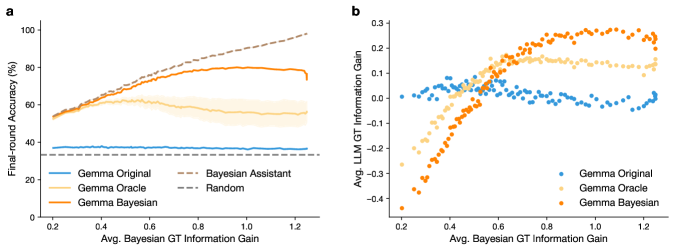
The image presents two scatter plots (labeled 'a' and 'b') comparing the performance of three Large Language Models (LLMs): Gemma Original, Gemma Oracle, and Gemma Bayesian, against a Bayesian Assistant and a Random baseline. Plot 'a' shows Final-round Accuracy as a function of Avg. Bayesian GT Information Gain, while plot 'b' shows Avg. LLM GT Information Gain as a function of Avg. Bayesian GT Information Gain. Shaded areas represent confidence intervals.
### Components/Axes
**Plot a:**
* **X-axis:** Avg. Bayesian GT Information Gain (ranging from approximately 0.2 to 1.2)
* **Y-axis:** Final-round Accuracy (%) (ranging from 0 to 100)
* **Data Series:**
* Gemma Original (solid blue line)
* Gemma Oracle (dashed blue line)
* Gemma Bayesian (solid orange line)
* Bayesian Assistant (dashed gray line)
* Random (dashed gray line)
**Plot b:**
* **X-axis:** Avg. Bayesian GT Information Gain (ranging from approximately 0.2 to 1.2)
* **Y-axis:** Avg. LLM GT Information Gain (ranging from approximately -0.4 to 0.3)
* **Data Series:**
* Gemma Original (blue dots)
* Gemma Oracle (blue dots)
* Gemma Bayesian (orange dots)
**Legend:**
The legend is positioned in the top-right corner of each plot, clearly associating colors and line styles with each model.
### Detailed Analysis or Content Details
**Plot a:**
* **Gemma Original:** The line is relatively flat, hovering around 20-30% accuracy across the range of Bayesian Information Gain.
* **Gemma Oracle:** Similar to Gemma Original, the line is flat, remaining around 20-30% accuracy.
* **Gemma Bayesian:** The line shows a clear upward trend. Starting around 40% accuracy at an Information Gain of 0.4, it rises to approximately 85% accuracy at an Information Gain of 1.0, then plateaus and slightly declines to around 75% at 1.2.
* **Bayesian Assistant:** The dashed gray line starts around 60% accuracy at 0.4, rises to approximately 95% at 0.8, and then remains relatively stable around 90-100% for the rest of the range.
* **Random:** The dashed gray line is nearly flat, fluctuating around 20-30% accuracy.
**Plot b:**
* **Gemma Original:** The data points show a generally flat trend, fluctuating around 0.05 to 0.15.
* **Gemma Oracle:** The data points show a generally flat trend, fluctuating around 0.05 to 0.15.
* **Gemma Bayesian:** The data points show a clear upward trend. Starting around -0.2 at an Information Gain of 0.4, it rises to approximately 0.25 at an Information Gain of 1.0, then declines slightly to around 0.2 at 1.2.
### Key Observations
* Gemma Bayesian consistently outperforms Gemma Original and Gemma Oracle in both plots.
* The Bayesian Assistant consistently achieves the highest accuracy in Plot a.
* Plot b shows a strong correlation between Avg. Bayesian GT Information Gain and Avg. LLM GT Information Gain for Gemma Bayesian.
* Gemma Original and Gemma Oracle show minimal improvement in accuracy or information gain as Bayesian Information Gain increases.
### Interpretation
The data suggests that incorporating Bayesian information gain significantly improves the performance of the Gemma model (Gemma Bayesian). The upward trend in both plots for Gemma Bayesian indicates that as the model gains more information through the Bayesian process, its accuracy (Plot a) and information gain (Plot b) increase. The flat lines for Gemma Original and Gemma Oracle suggest that they do not effectively utilize the Bayesian information gain. The Bayesian Assistant serves as a strong benchmark, demonstrating the potential of Bayesian approaches. The Random baseline highlights the importance of informed decision-making over chance. The confidence intervals (shaded areas in Plot a) indicate the variability in the results, but the overall trends remain clear. The decline in Gemma Bayesian's performance at the highest Information Gain values in Plot a might indicate a point of diminishing returns or potential overfitting.