## Diagram: Populations in LLM-based AHD and Tree Search Iterations
### Overview
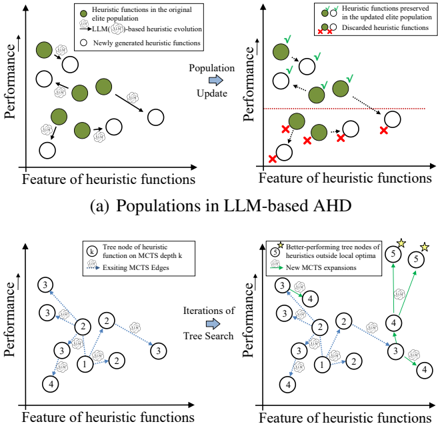
The image presents two sets of diagrams illustrating the evolution of heuristic functions in a population using an LLM-based AHD (Adaptive Heuristic Diversity) approach, and the iterations of tree search. The first set (top row) shows the population update process, while the second set (bottom row) depicts the tree search iterations.
### Components/Axes
**Top Row Diagrams:**
* **Axes:** Both diagrams in the top row share the same axes:
* X-axis: "Feature of heuristic functions"
* Y-axis: "Performance"
* **Legend (Top-Left Diagram):**
* Green filled circle: "Heuristic functions in the original elite population"
* Gray arrow with "LLM" text: "LLM(1/H)-based heuristic evolution" (uncertainty in the exact fraction)
* White filled circle: "Newly generated heuristic functions"
* **Legend (Top-Right Diagram):**
* Green filled circle with a checkmark: "Heuristic functions preserved in the updated elite population"
* Red "X" mark: "Discarded heuristic functions"
* **Other Annotations (Top Row):**
* "Population" with an arrow pointing to "Update" (between the two diagrams)
* Red dashed line in the right diagram.
**Bottom Row Diagrams:**
* **Axes:** Both diagrams in the bottom row share the same axes:
* X-axis: "Feature of heuristic functions"
* Y-axis: "Performance"
* **Legend (Bottom-Left Diagram):**
* Circle with a number inside: "Tree node of heuristic function on MCTS depth k"
* Dotted arrow: "Exsiting MCTS Edges" (Typo in original text: "Exsiting")
* **Legend (Bottom-Right Diagram):**
* Yellow star in a circle with a number inside: "Better-performing tree nodes of heuristics outside local optima"
* Solid green arrow: "New MCTS expansions"
* **Other Annotations (Bottom Row):**
* "Iterations of Tree Search" with an arrow pointing from the left diagram to the right diagram.
### Detailed Analysis
**Top-Left Diagram (Initial Population):**
* Shows a scatter plot of heuristic functions.
* The green filled circles (original elite population) are clustered towards the top-left.
* White filled circles (newly generated heuristic functions) are scattered around.
* Gray arrows indicate the evolution of heuristic functions, originating from the green circles and pointing towards other locations.
**Top-Right Diagram (Updated Population):**
* Shows the updated population after the LLM-based AHD process.
* Green filled circles with checkmarks represent preserved heuristic functions.
* Red "X" marks indicate discarded heuristic functions.
* The red dashed line appears to act as a threshold, with heuristic functions below it being discarded.
**Bottom-Left Diagram (Initial Tree Search):**
* Shows a tree search process with nodes labeled with numbers (1 to 4).
* Dotted arrows indicate existing MCTS (Monte Carlo Tree Search) edges.
* The general trend of the edges is downward, suggesting a decrease in performance as the search progresses.
**Bottom-Right Diagram (Tree Search Iterations):**
* Shows the tree search after iterations.
* Yellow stars in circles indicate better-performing tree nodes outside local optima.
* Solid green arrows represent new MCTS expansions.
* The new expansions lead to nodes with higher performance (nodes labeled 5).
### Key Observations
* The LLM-based AHD process (top row) aims to improve the population of heuristic functions by preserving high-performing ones and discarding low-performing ones.
* The tree search iterations (bottom row) explore the search space and identify better-performing nodes outside local optima.
### Interpretation
The diagrams illustrate a process for optimizing heuristic functions using a combination of population-based evolution (LLM-based AHD) and tree search techniques. The LLM-based AHD helps to maintain a diverse and high-performing population, while the tree search explores the search space to find even better solutions. The red dashed line in the top-right diagram suggests a performance threshold for preserving heuristic functions. The bottom-right diagram shows how new MCTS expansions can lead to improved solutions, represented by the nodes labeled "5" with yellow stars. The combination of these two approaches likely leads to a more effective optimization process.