TECHNICAL ASSET FINGERPRINT
156ad15b6a3265d9b5b78ce0
Click to view fullscreen
Press ESC or click to close
FOUND IN PAPERS
EXPERT: healer-alpha-free VERSION 1
RUNTIME: free/openrouter/healer-alpha
INTEL_VERIFIED
\n
## Diagram: Heuristic Function Evolution and Tree Search in LLM-based AHD and MCTS
### Overview
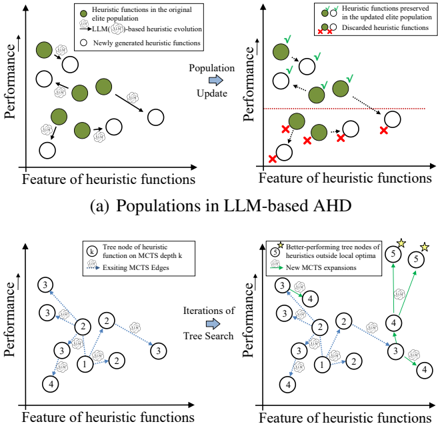
The image contains two multi-part conceptual diagrams, labeled (a) and (b), illustrating processes for evolving heuristic functions. Diagram (a) depicts a population-based update mechanism for "LLM-based AHD," while diagram (b) illustrates an iterative tree search process for "MCTS." Both diagrams plot "Performance" (vertical axis) against "Feature of heuristic functions" (horizontal axis) to visualize selection and expansion.
### Components/Axes
**Common Elements (Both Diagrams):**
* **Vertical Axis:** Labeled "Performance." Arrow points upward, indicating higher performance is better.
* **Horizontal Axis:** Labeled "Feature of heuristic functions." Arrow points rightward, indicating a change in feature space.
* **Visual Elements:** Circles represent heuristic functions or tree nodes. Arrows represent processes or relationships.
**Diagram (a): Populations in LLM-based AHD**
* **Left Sub-diagram:**
* **Legend (Top-Left):**
* Green filled circle: "Heuristic functions in the original population"
* White circle with dashed border: "Newly generated heuristic functions"
* Solid black arrow: "LLM-based heuristic evolution"
* **Content:** Shows a mix of green (original) and white (new) circles scattered across the performance-feature space. Black arrows point from some circles to others, indicating evolutionary steps.
* **Right Sub-diagram:**
* **Legend (Top-Right):**
* Green circle with a green checkmark: "Heuristic functions preserved"
* White circle with a red 'X': "Discarded heuristic functions"
* **Content:** A horizontal red line is drawn across the middle of the plot. Circles above the line are green with checkmarks. Circles below the line are white with red 'X's.
* **Process Arrow:** A large arrow labeled "Populations Update" points from the left to the right sub-diagram.
**Diagram (b): Iterations of Tree Search**
* **Left Sub-diagram:**
* **Legend (Top-Left):**
* Numbered circle (1, 2, 3, 4): "Tree node of heuristic functions on MCTS depth k"
* Grey arrow: "Existing MCTS Edges"
* **Content:** Shows a tree structure with numbered nodes connected by grey arrows. Nodes are distributed at different performance levels.
* **Right Sub-diagram:**
* **Legend (Top-Right):**
* Numbered circle with a yellow star: "Better-performing tree nodes or heuristics outside local optima"
* Green arrow: "New MCTS expansions"
* **Content:** The original tree is shown. New green arrows extend from some existing nodes (e.g., node 3) to new, higher-performing nodes (e.g., a new node 5 with a star). Some existing nodes (e.g., node 4) also gain stars, indicating they are now identified as better-performing.
* **Process Arrow:** A large arrow labeled "Iterations of Tree Search" points from the left to the right sub-diagram.
### Detailed Analysis
**Diagram (a) Process Flow:**
1. **Initial State (Left):** A population consists of original heuristics (green) and newly generated ones (white), spread across a feature-performance landscape.
2. **Evolution:** Black arrows show LLM-based evolution creating new heuristics from existing ones.
3. **Selection (Right):** A performance threshold (red line) is applied. Heuristics above the threshold are preserved (green with checkmarks). Those below are discarded (white with red Xs). This is a clear visualization of selection pressure based on performance.
**Diagram (b) Process Flow:**
1. **Initial Tree (Left):** An MCTS tree exists at depth `k`, with nodes representing heuristics at various performance levels.
2. **Search & Expansion (Right):** The search identifies better-performing nodes (starred) both within the existing tree and in new regions of the feature space.
3. **Growth:** New expansions (green arrows) are made from promising nodes (like node 3) to explore these higher-performance areas, leading to new nodes (like node 5).
### Key Observations
1. **Performance-Centric Selection:** Both diagrams use the vertical "Performance" axis as the primary criterion for success. In (a), it's a hard threshold; in (b), it guides exploration.
2. **Exploration vs. Exploitation:** Diagram (a) shows exploration via new function generation and exploitation via selection. Diagram (b) shows exploitation of known good nodes (adding stars) and exploration via new expansions into uncharted feature space (green arrows to new nodes).
3. **Spatial Metaphor:** The "Feature of heuristic functions" axis is abstract but implies a multi-dimensional space where distance may represent dissimilarity. The diagrams suggest that better performance can be found by moving through this space.
4. **Visual Coding:** Consistent use of color (green=good/preserved, white/red=bad/discarded, yellow star=noteworthy) and symbols (checkmarks, Xs, stars) reinforces the narrative without needing numerical data.
### Interpretation
These diagrams are **conceptual models** illustrating two different algorithmic strategies for improving heuristic functions, likely within the context of AI planning or optimization.
* **Diagram (a) - Population-Based Evolution:** This represents a **generational selection model**. It suggests a process where an LLM generates candidate heuristics, which are then evaluated. Only the top-performing candidates (above a threshold) survive to the next generation. This is akin to evolutionary algorithms or reinforcement learning with a performance cutoff. The key takeaway is that improvement is driven by iterative generation and harsh selection.
* **Diagram (b) - Guided Tree Search:** This represents an **informed search model**. It modifies the classic Monte Carlo Tree Search (MCTS) by using heuristic functions at its nodes. The process doesn't just simulate random playouts; it actively identifies and expands from nodes that are "better-performing" or represent escapes from local optima. The stars indicate a meta-cognitive step where the algorithm recognizes promising directions. Improvement comes from strategically allocating search effort to high-potential areas of the feature space.
**Underlying Message:** Both methods aim to navigate a "performance landscape" defined by heuristic features. They avoid random search by using performance feedback—one via population filtering, the other via guided expansion. The diagrams argue that intelligent improvement requires both generating diverse candidates (exploration) and rigorously evaluating them against a performance metric (exploitation). The absence of specific numbers emphasizes that these are general frameworks applicable to various problem domains.
DECODING INTELLIGENCE...