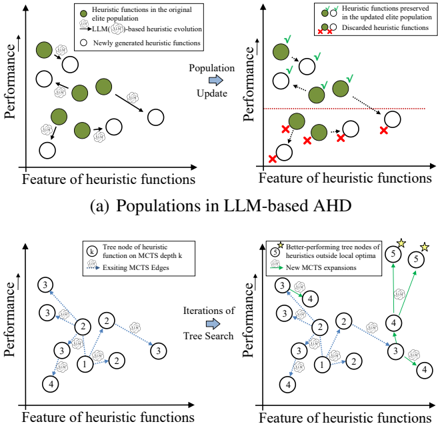
## Diagram: LLM-Based Adaptive Heuristic Discovery (AHD) Framework
### Overview
The image presents two comparative diagrams illustrating heuristic function evolution and optimization in LLM-based AHD systems. Diagram (a) focuses on population dynamics, while diagram (b) details tree-based heuristic search mechanisms. Both use performance-feature tradeoff visualizations with distinct evolutionary strategies.
### Components/Axes
#### Diagram (a): Populations in LLM-Based AHD
- **Axes**:
- X-axis: "Feature of heuristic functions" (categorical, no scale)
- Y-axis: "Performance" (continuous, no numerical scale)
- **Legends**:
- Green circles: "Heuristic functions in the original elite population"
- White circles: "Newly generated heuristic functions"
- Red Xs: "Discarded heuristic functions"
- **Key Elements**:
- Arrows labeled "Population Update" showing directional flow
- Horizontal red line labeled "Performance threshold"
#### Diagram (b): Tree Node Heuristic Functions
- **Axes**:
- X-axis: "Feature of heuristic functions" (categorical, no scale)
- Y-axis: "Performance" (continuous, no numerical scale)
- **Legends**:
- Green circles: "Better-performing tree nodes of heuristic functions"
- Stars: "New MCTS expansions"
- **Key Elements**:
- Tree structure with nodes labeled 1–4
- Arrows labeled "Iterations of Tree Search"
- Dashed lines labeled "Existing MCTS Edges"
### Detailed Analysis
#### Diagram (a)
- **Original vs. New Functions**:
- Green circles (original elite population) cluster in the mid-to-high performance range.
- White circles (newly generated functions) show mixed performance, with some overlapping the original cluster and others near the threshold.
- **Discarded Functions**:
- Red Xs appear below the performance threshold, indicating elimination during updates.
- **Trend**:
- Population updates shift heuristic functions toward higher performance, with discarding of underperforming variants.
#### Diagram (b)
- **Tree Search Process**:
- Nodes 1–4 represent heuristic functions at different search iterations.
- Node 4 (final iteration) shows improved performance compared to earlier nodes.
- **MCTS Expansions**:
- Stars indicate new Monte Carlo Tree Search (MCTS) expansions, correlating with performance gains.
- **Trend**:
- Iterative tree search refines heuristic functions, with later nodes achieving higher performance.
### Key Observations
1. **Performance Thresholding**: Diagram (a) explicitly shows a cutoff for discarding low-performing functions, while diagram (b) implies optimization through iterative search.
2. **Evolutionary Mechanisms**:
- Diagram (a) emphasizes population-based selection (elitism + mutation).
- Diagram (b) highlights tree-based exploration (MCTS) for heuristic refinement.
3. **Visual Ambiguity**:
- No numerical performance values are provided, making quantitative analysis impossible.
- The "Feature of heuristic functions" axis lacks granularity (e.g., no feature dimensions like computational cost or accuracy).
### Interpretation
The diagrams illustrate two complementary strategies for heuristic optimization in LLM-based AHD:
1. **Population Dynamics (a)**:
- Combines elitism (preserving top performers) with mutation (new functions) and culling (discarding poor performers).
- The red threshold suggests a performance floor for survival, akin to survival-of-the-fittest in evolutionary algorithms.
2. **Tree Search (b)**:
- Uses MCTS to explore heuristic function space, with expansions (stars) enabling deeper optimization.
- Node progression (1→4) implies iterative refinement, where later iterations leverage prior knowledge (existing edges).
**Notable Insights**:
- The absence of numerical performance metrics limits direct comparison between strategies.
- The red threshold in (a) and star-based performance in (b) suggest hybrid approaches could combine population-based selection with tree-guided exploration for robust AHD.
- The diagrams emphasize *relative* performance improvements rather than absolute values, focusing on evolutionary trajectories over static benchmarks.