## Sankey Diagram: Relations between Entities
### Overview
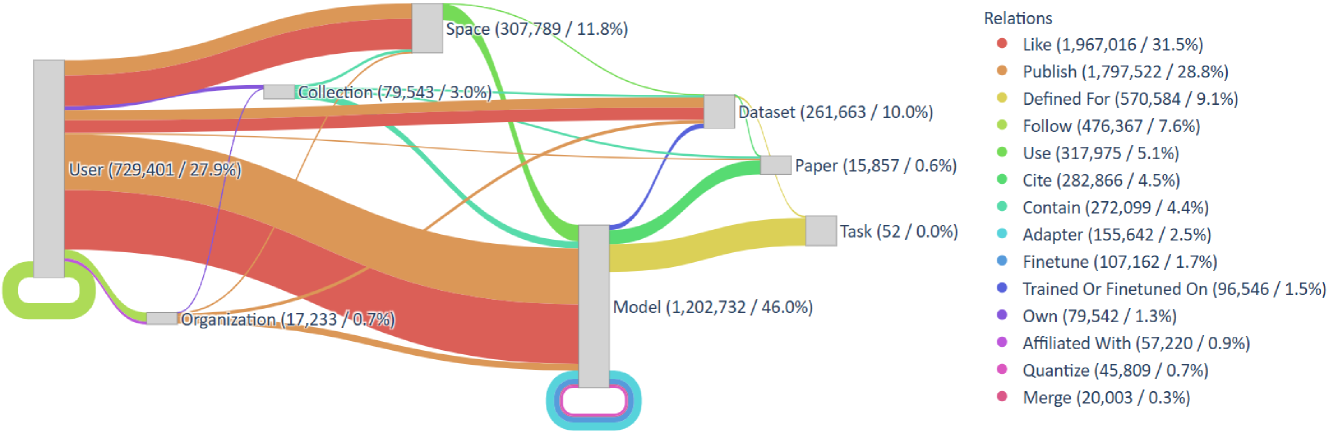
The image is a Sankey diagram illustrating the relationships between different entities (User, Space, Collection, Organization) and their connections to other entities (Dataset, Paper, Task, Model) through various relations (Like, Publish, Defined For, etc.). The diagram shows the flow of connections, with the width of the bands representing the magnitude of the relationship. The diagram is split into two columns, with the entities on the left and the relations on the right.
### Components/Axes
* **Entities (Left Side):**
* User (729,401 / 27.9%)
* Space (307,789 / 11.8%)
* Collection (79,543 / 3.0%)
* Organization (17,233 / 0.7%)
* **Entities (Right Side):**
* Dataset (261,663 / 10.0%)
* Paper (15,857 / 0.6%)
* Task (52 / 0.0%)
* Model (1,202,732 / 46.0%)
* **Relations (Legend - Top Right):**
* Like (1,967,016 / 31.5%) - Red
* Publish (1,797,522 / 28.8%) - Orange
* Defined For (570,584 / 9.1%) - Yellow
* Follow (476,367 / 7.6%) - Green
* Use (317,975 / 5.1%) - Light Green
* Cite (282,866 / 4.5%) - Teal
* Contain (272,099 / 4.4%) - Cyan
* Adapter (155,642 / 2.5%) - Light Blue
* Finetune (107,162 / 1.7%) - Blue
* Trained Or Finetuned On (96,546 / 1.5%) - Dark Blue
* Own (79,542 / 1.3%) - Purple
* Affiliated With (57,220 / 0.9%) - Pink
* Quantize (45,809 / 0.7%) - Light Pink
* Merge (20,003 / 0.3%) - Dark Pink
### Detailed Analysis
* **User:**
* The largest flow from User is to Like (Red), followed by Publish (Orange), Defined For (Yellow), Follow (Green), Use (Light Green), Cite (Teal), Contain (Cyan), Adapter (Light Blue), Finetune (Blue), Trained Or Finetuned On (Dark Blue), Own (Purple), Affiliated With (Pink), Quantize (Light Pink), Merge (Dark Pink).
* **Space:**
* The largest flow from Space is to Model (46.0%), followed by Dataset (10.0%).
* **Collection:**
* The largest flow from Collection is to Dataset (10.0%).
* **Organization:**
* The largest flow from Organization is to Model (46.0%).
* **Dataset:**
* The Dataset entity receives connections from User, Space, and Collection.
* **Paper:**
* The Paper entity receives connections from User.
* **Task:**
* The Task entity receives connections from User.
* **Model:**
* The Model entity receives connections from Space and Organization.
### Key Observations
* The Model entity has the highest percentage (46.0%) on the right side, indicating it is the most common destination for the relationships shown.
* The User entity has the highest percentage (27.9%) on the left side, indicating it is the most common origin for the relationships shown.
* The "Like" and "Publish" relations are the most frequent, with 31.5% and 28.8% respectively.
* The "Task" entity has the lowest percentage (0.0%) on the right side.
### Interpretation
The Sankey diagram visualizes the relationships between different entities and their connections through various relations. The diagram suggests that "Model" is the most common destination, indicating a strong focus on models in the data. "User" is the most common origin, suggesting that users are the primary actors in these relationships. The high percentages for "Like" and "Publish" indicate that these are the most common types of interactions. The low percentage for "Task" suggests that tasks are less frequently associated with the entities shown in this diagram. The diagram provides a high-level overview of the relationships between entities and relations, highlighting the most important connections and patterns.