## Network Diagram: Entity Relationships and Interaction Metrics
### Overview
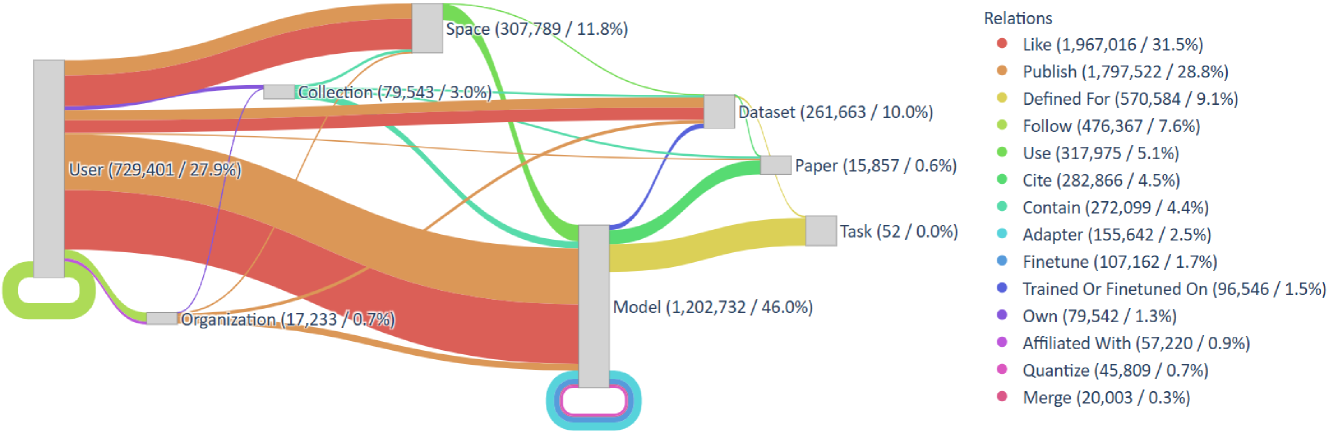
The image depicts a complex network diagram illustrating relationships between entities (nodes) and interactions (edges). Nodes represent entities like "User," "Model," "Dataset," and "Paper," while edges represent relationships such as "Publish," "Use," and "Contain." Each node and edge is labeled with numerical values and percentages, indicating their relative proportions within the system.
### Components/Axes
- **Nodes**:
- Labeled with entity names (e.g., "User," "Model," "Dataset") and associated values (e.g., "User (729,401 / 27.9%)").
- Colors: Red, green, blue, yellow, and gray.
- **Edges**:
- Labeled with relationship types (e.g., "Collection," "Defined For," "Use") and associated values (e.g., "Collection (79,543 / 3.0%)").
- Colors: Red, orange, green, blue, purple, and gray.
- **Legend**:
- Located on the right, mapping colors to relationship types (e.g., red = "Like," orange = "Publish," green = "Use").
- Includes 14 relationship types with percentages (e.g., "Like (1,967,016 / 31.5%)").
### Detailed Analysis
#### Nodes
1. **User**: 729,401 instances (27.9% of total).
2. **Organization**: 17,233 instances (0.7%).
3. **Space**: 307,789 instances (11.8%).
4. **Collection**: 79,543 instances (3.0%).
5. **Dataset**: 261,663 instances (10.0%).
6. **Paper**: 15,857 instances (0.6%).
7. **Task**: 52 instances (0.0%).
8. **Model**: 1,202,732 instances (46.0%).
#### Edges
1. **Like**: 1,967,016 (31.5%).
2. **Publish**: 1,797,522 (28.8%).
3. **Defined For**: 570,584 (9.1%).
4. **Follow**: 476,367 (7.6%).
5. **Use**: 317,975 (5.1%).
6. **Cite**: 282,866 (4.5%).
7. **Contain**: 272,099 (4.4%).
8. **Adapter**: 155,642 (2.5%).
9. **Finetune**: 107,162 (1.7%).
10. **Trained Or Finetuned On**: 96,546 (1.5%).
11. **Own**: 79,542 (1.3%).
12. **Affiliated With**: 57,220 (0.9%).
13. **Quantize**: 45,809 (0.7%).
14. **Merge**: 20,003 (0.3%).
### Key Observations
1. **Dominant Entities**:
- "Model" is the largest node (46.0%), followed by "User" (27.9%) and "Dataset" (10.0%).
- "Task" has negligible presence (0.0%).
2. **Dominant Relationships**:
- "Like" and "Publish" are the most frequent interactions (31.5% and 28.8%, respectively).
- "Merge" is the least frequent (0.3%).
3. **Color Consistency**:
- All edge colors match the legend (e.g., red edges correspond to "Like").
- Node colors vary but lack a clear legend mapping.
### Interpretation
- **Central Role of Models**: The "Model" node's dominance (46.0%) suggests it is a core component of the system, likely serving as a hub for interactions like "Publish" and "Use."
- **User-Driven Activity**: The "User" node's size (27.9%) and connections to "Model" and "Dataset" indicate users are primary actors driving interactions.
- **High-Frequency Relationships**: "Like" and "Publish" dominate, implying these are foundational to the system's functionality (e.g., content sharing or collaboration).
- **Anomalies**:
- "Task" has no instances (0.0%), which may indicate incomplete data or a placeholder.
- "Merge" is rare (0.3%), possibly reflecting a specialized or infrequent operation.
- **Color Coding**: The legend provides clarity for edge relationships but lacks node color explanations, leaving their significance ambiguous.
This diagram highlights a system where models and user interactions are central, with "Publish" and "Like" as key drivers. The low frequency of "Merge" and "Task" warrants further investigation into their roles or data completeness.