## Line Chart: Computation Time vs. Sequence Length for Flash Attention and MoBA
### Overview
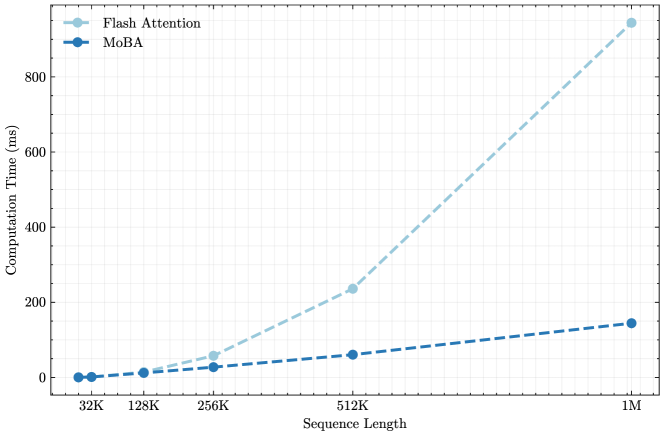
The image is a line chart comparing the computational performance of two methods, "Flash Attention" and "MoBA," as the input sequence length increases. The chart demonstrates a significant divergence in scalability between the two approaches.
### Components/Axes
* **Chart Type:** Line chart with markers.
* **X-Axis (Horizontal):**
* **Label:** "Sequence Length"
* **Scale:** Logarithmic (base 2). The labeled tick marks are at 32K, 128K, 256K, 512K, and 1M.
* **Y-Axis (Vertical):**
* **Label:** "Computation Time (ms)"
* **Scale:** Linear, ranging from 0 to approximately 950 ms. Major grid lines are at intervals of 200 ms (0, 200, 400, 600, 800).
* **Legend:** Located in the top-left corner of the plot area.
* **Flash Attention:** Represented by a light blue, dashed line with circular markers.
* **MoBA:** Represented by a dark blue, dashed line with circular markers.
* **Grid:** A light gray grid is present for both axes.
### Detailed Analysis
**Data Series 1: Flash Attention (Light Blue, Dashed Line)**
* **Trend:** The line exhibits a steep, upward-curving (super-linear, likely quadratic or worse) trend. Computation time increases dramatically with sequence length.
* **Approximate Data Points:**
* At 32K: ~5 ms
* At 128K: ~20 ms
* At 256K: ~60 ms
* At 512K: ~240 ms
* At 1M: ~940 ms
**Data Series 2: MoBA (Dark Blue, Dashed Line)**
* **Trend:** The line shows a gentle, upward-sloping linear trend. Computation time increases at a much slower, more manageable rate.
* **Approximate Data Points:**
* At 32K: ~2 ms
* At 128K: ~10 ms
* At 256K: ~25 ms
* At 512K: ~60 ms
* At 1M: ~150 ms
### Key Observations
1. **Performance Crossover:** At the shortest sequence length (32K), the two methods have very similar computation times (both under 10 ms). MoBA is marginally faster.
2. **Divergence Point:** The performance gap begins to widen noticeably at 128K and becomes substantial at 256K.
3. **Scalability Disparity:** At the longest sequence length shown (1M), Flash Attention's computation time (~940 ms) is over **6 times slower** than MoBA's (~150 ms).
4. **Growth Pattern:** Flash Attention's time grows at an accelerating rate, while MoBA's growth appears constant and linear.
### Interpretation
This chart provides a clear performance benchmark demonstrating the superior scalability of the MoBA method compared to Flash Attention for long-sequence processing tasks.
* **What the data suggests:** The data strongly indicates that MoBA is a more efficient algorithm for handling very long sequences (e.g., in large language models or high-resolution data processing). Its linear time complexity makes it predictable and practical for scaling to million-length sequences, whereas Flash Attention becomes prohibitively expensive.
* **Relationship between elements:** The x-axis (Sequence Length) is the independent variable, representing the problem size. The y-axis (Computation Time) is the dependent variable, measuring the cost. The two lines represent competing solutions to the same problem. The widening gap between them visually argues for the adoption of MoBA in scenarios requiring long-context windows.
* **Notable Anomalies/Trends:** The most critical trend is the difference in growth order. Flash Attention's curve suggests O(n²) or similar complexity, while MoBA's line suggests O(n) complexity. This fundamental difference in algorithmic efficiency is the core insight of the chart. There are no outliers; the data points follow their respective trends perfectly, indicating a controlled and consistent benchmark.