\n
## Chart: Benchmark Distribution Across Disciplines
### Overview
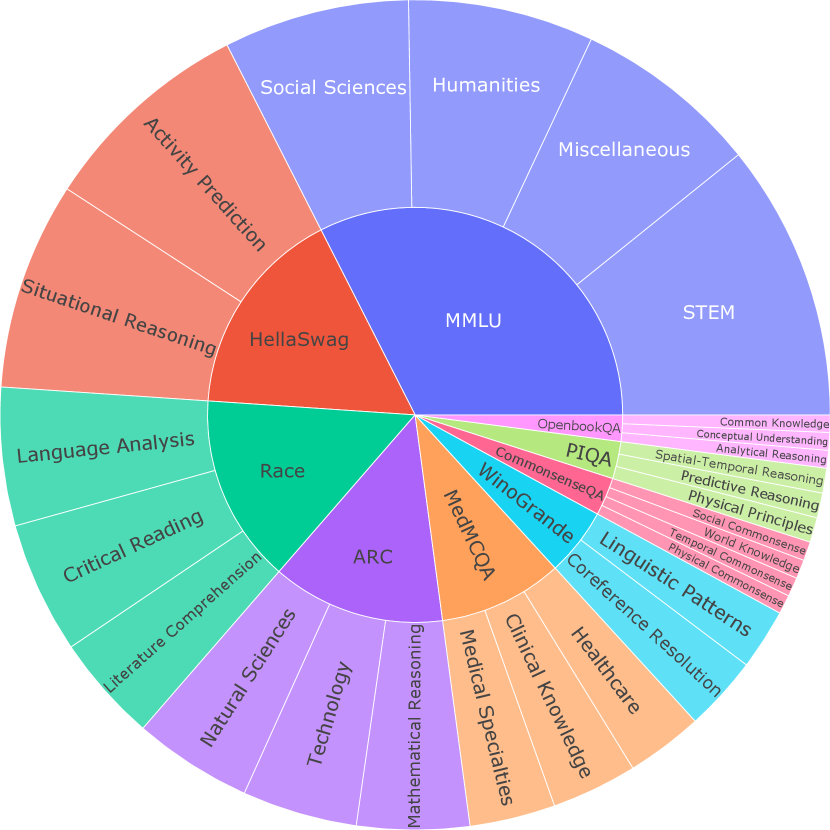
This image presents a circular chart illustrating the distribution of various AI benchmarks across different academic disciplines. The chart is a segmented circle, resembling a pie chart, with each segment representing a benchmark and colored according to the discipline it primarily assesses. The chart is divided into four main quadrants: Humanities, Social Sciences, STEM, and Miscellaneous.
### Components/Axes
The chart does not have traditional axes. Instead, it uses colored segments to represent benchmarks and labels to identify both the benchmarks and the disciplines. The disciplines are labeled in large, bold text within the quadrants. The benchmarks are labeled along the curved edges of their respective segments.
**Disciplines:**
* Humanities (Purple)
* Social Sciences (Red)
* STEM (Green)
* Miscellaneous (Yellow)
**Benchmarks:**
* MMLU
* HellaSwag
* Activity Prediction
* Situational Reasoning
* Language Analysis
* Critical Reading
* Literature Comprehension
* Natural Sciences
* Technology
* Mathematical Reasoning
* Medical Specialities
* Clinical Knowledge
* Healthcare
* Linguistic Patterns
* Coreference Resolution
* Winograde
* CommonsenseQA
* PIQA
* OpenbookQA
* MedMCQA
* ARC
* Race
**Sub-categories within STEM (listed vertically in the right quadrant):**
* Common Knowledge
* Conceptual Understanding
* Analytical Reasoning
* Spatial-Temporal Reasoning
* Predictive Reasoning
* Physical Principles
* Social Commonsense
* World Knowledge
* Temporal Knowledge
* Physical Commonsense
### Detailed Analysis
The chart shows a varied distribution of benchmarks across the disciplines.
* **Humanities:** Contains only MMLU.
* **Social Sciences:** Contains Activity Prediction, Situational Reasoning, and HellaSwag. HellaSwag appears to take up approximately 25% of the Social Sciences quadrant. Activity Prediction and Situational Reasoning appear to be roughly equal in size.
* **STEM:** Contains a large number of benchmarks, including OpenbookQA, PIQA, CommonsenseQA, Winograde, MedMCQA, ARC, Race, and a list of sub-categories. The sub-categories are listed vertically and take up a significant portion of the STEM quadrant. OpenbookQA and PIQA appear to be the largest segments within STEM.
* **Miscellaneous:** Contains a small segment labeled "Miscellaneous".
* **Natural Sciences:** Contains Literature Comprehension and Critical Reading.
* **Technology:** Contains ARC and Race.
* **Mathematical Reasoning:** Contains ARC.
* **Medical Specialities:** Contains MedMCQA.
* **Clinical Knowledge:** Contains Winograde.
* **Healthcare:** Contains Linguistic Patterns and Coreference Resolution.
The relative sizes of the segments indicate the relative prominence or complexity of the benchmarks within each discipline. For example, MMLU appears to be the dominant benchmark in the Humanities, while STEM has a much more diverse set of benchmarks.
### Key Observations
* STEM has the most diverse set of benchmarks, suggesting a broader range of assessment areas within this discipline.
* The Humanities are represented by a single benchmark, MMLU.
* The Miscellaneous category is very small, indicating that there are few benchmarks that don't fit neatly into the other categories.
* Some benchmarks appear to overlap between disciplines (e.g., ARC appears in both Technology and Mathematical Reasoning).
### Interpretation
This chart provides a visual overview of how different AI benchmarks are aligned with various academic disciplines. It suggests that certain disciplines, like STEM, require a more comprehensive set of assessment tools than others. The chart could be used to understand the strengths and weaknesses of current AI models in different areas of knowledge. The overlap of benchmarks between disciplines highlights the interdisciplinary nature of many AI tasks. The chart also suggests potential areas for further research and development of new benchmarks, particularly in the Humanities and Miscellaneous categories. The detailed breakdown of sub-categories within STEM indicates the complexity of evaluating AI capabilities in this field. The chart is a useful tool for researchers and practitioners interested in understanding the landscape of AI benchmarks and their relationship to academic disciplines.