## Chart: Mean Error over Time
### Overview
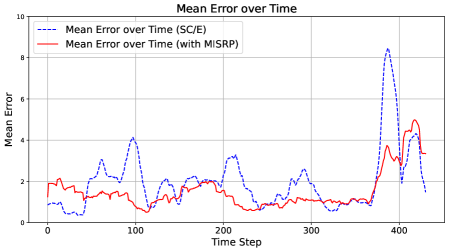
The image is a line chart comparing the mean error over time for two different methods: one labeled "SC/E" and the other "with MISRP". The x-axis represents the time step, and the y-axis represents the mean error. The chart displays how the mean error changes over time for each method.
### Components/Axes
* **Title:** Mean Error over Time
* **X-axis:** Time Step (ranging from 0 to 400)
* **Y-axis:** Mean Error (ranging from 0 to 10)
* **Legend:** Located in the top-left corner.
* Blue dashed line: Mean Error over Time (SC/E)
* Red solid line: Mean Error over Time (with MISRP)
* Gridlines are present on the chart.
### Detailed Analysis
* **Mean Error over Time (SC/E) - Blue Dashed Line:**
* Starts at approximately 1.75 at time step 0.
* Decreases to approximately 0.5 around time step 50.
* Increases to approximately 4.25 around time step 100.
* Fluctuates between 1.5 and 3.5 between time steps 100 and 350.
* Experiences a sharp increase to approximately 8.5 around time step 400.
* Decreases to approximately 2 around time step 410.
* Rises again to approximately 4.5 around time step 420.
* **Mean Error over Time (with MISRP) - Red Solid Line:**
* Starts at approximately 2 at time step 0.
* Decreases to approximately 1.25 around time step 50.
* Increases to approximately 2 around time step 75.
* Fluctuates between 1 and 2 between time steps 100 and 375.
* Experiences a sharp increase to approximately 5 around time step 400.
* Decreases slightly to approximately 3.5 around time step 420.
### Key Observations
* The "SC/E" method (blue dashed line) generally has a higher mean error than the "with MISRP" method (red solid line) for most of the time steps.
* Both methods experience a significant increase in mean error around time step 400, but the "SC/E" method's increase is more pronounced.
* The "SC/E" method shows more volatility in mean error compared to the "with MISRP" method.
### Interpretation
The chart suggests that the "with MISRP" method generally performs better in terms of mean error compared to the "SC/E" method. The sharp increase in error for both methods around time step 400 could indicate a critical point or change in the system being evaluated. The higher volatility of the "SC/E" method suggests it may be more sensitive to changes or disturbances in the system. The data implies that incorporating MISRP leads to a more stable and lower mean error over time, especially before the spike at time step 400.