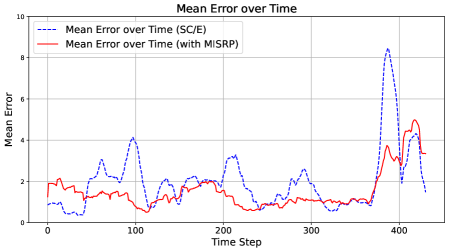
## Line Chart: Mean Error over Time
### Overview
The image displays a line chart comparing the "Mean Error" of two different methods or conditions over a series of time steps. The chart illustrates how the average error metric fluctuates and evolves for each method across the observed period.
### Components/Axes
* **Chart Title:** "Mean Error over Time" (centered at the top).
* **Y-Axis:**
* **Label:** "Mean Error" (vertical text on the left).
* **Scale:** Linear scale ranging from 0 to 10, with major tick marks at intervals of 2 (0, 2, 4, 6, 8, 10).
* **X-Axis:**
* **Label:** "Time Step" (horizontal text at the bottom).
* **Scale:** Linear scale ranging from 0 to approximately 430, with major tick marks labeled at 0, 100, 200, 300, and 400.
* **Legend:** Positioned in the top-left corner of the plot area.
* **Entry 1:** A blue dashed line (`---`) labeled "Mean Error over Time (SC/E)".
* **Entry 2:** A red solid line (`—`) labeled "Mean Error over Time (with MISRP)".
* **Grid:** A light gray grid is present, aligning with the major ticks on both axes.
### Detailed Analysis
**Data Series 1: Mean Error over Time (SC/E) - Blue Dashed Line**
* **Trend Verification:** This series exhibits high volatility with several pronounced peaks and troughs. It shows a general pattern of fluctuating error with a dramatic, sharp spike in the later time steps.
* **Key Data Points (Approximate):**
* Starts near 1.0 at Time Step 0.
* First major peak: ~4.2 at Time Step ~100.
* Subsequent peaks: ~3.5 at Time Step ~210, ~2.8 at Time Step ~290.
* **Major Outlier Spike:** Rises sharply to its maximum value of approximately **8.5** at Time Step ~380.
* After the spike, it drops rapidly to ~1.5 by Time Step ~430.
**Data Series 2: Mean Error over Time (with MISRP) - Red Solid Line**
* **Trend Verification:** This series is generally smoother and maintains a lower mean error compared to the blue line for most of the timeline. It shows a gradual increase in error towards the end of the observed period.
* **Key Data Points (Approximate):**
* Starts near 2.0 at Time Step 0.
* Fluctuates between approximately 0.5 and 2.5 for the majority of the timeline (Time Steps 0-350).
* Begins a steady increase after Time Step 350.
* Reaches its peak of approximately **5.0** at Time Step ~410.
* Ends at approximately 3.5 at Time Step ~430.
### Key Observations
1. **Performance Divergence:** The "with MISRP" method (red line) consistently yields a lower mean error than the "SC/E" method (blue line) from approximately Time Step 50 to Time Step 370.
2. **Critical Anomaly:** The "SC/E" method experiences a severe, isolated error spike (to ~8.5) around Time Step 380, which is the most prominent feature of the chart.
3. **Late-Stage Convergence and Crossover:** Following the major spike, the error for "SC/E" plummets. Meanwhile, the error for "with MISRP" rises, leading to a crossover point around Time Step 400 where the red line's error exceeds the blue line's error for the first time since the early stages.
4. **Volatility:** The "SC/E" series is significantly more volatile, characterized by sharper and higher peaks throughout the timeline.
### Interpretation
The data suggests that the **MISRP** technique is effective at suppressing and stabilizing the mean error over a long duration compared to the baseline **SC/E** method. The MISRP line demonstrates better control and lower average error for over 80% of the observed time steps.
However, the dramatic spike in the SC/E error around Time Step 380 indicates a potential critical failure mode, instability, or a specific challenging event in the process being measured that the SC/E method is highly sensitive to. The subsequent rapid recovery is notable.
The late-stage rise in error for the MISRP method and the crossover event suggest that its advantage may diminish or reverse under certain prolonged conditions or after a specific temporal threshold. This could imply that MISRP's error suppression has a time-dependent efficacy or that it accumulates error differently over very long runs.
**In summary:** MISRP provides superior and more stable performance for the majority of the operational window but shows a concerning late-stage error increase. The SC/E method is less stable overall and is vulnerable to extreme, transient error spikes. The choice between them may depend on whether consistent mid-term performance (favoring MISRP) or resilience to late-stage drift (where SC/E appears better after its spike) is more critical for the application.