## Line Graph: Mean Error over Time
### Overview
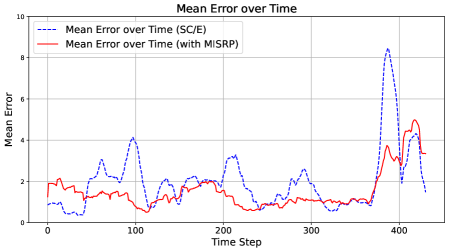
The image is a line graph comparing two error metrics over time steps. It shows the mean error for two scenarios: "SC/E" (blue dashed line) and "with MISRP" (red solid line). The x-axis represents time steps (0–400), and the y-axis represents mean error (0–10). The graph highlights fluctuations in error rates, with notable spikes in both series.
### Components/Axes
- **X-axis**: "Time Step" (0–400, linear scale).
- **Y-axis**: "Mean Error" (0–10, linear scale).
- **Legend**: Located in the top-left corner, with two entries:
- Blue dashed line: "Mean Error over Time (SC/E)"
- Red solid line: "Mean Error over Time (with MISRP)"
- **Gridlines**: Horizontal and vertical gridlines at integer intervals.
### Detailed Analysis
1. **SC/E (Blue Dashed Line)**:
- **Trend**: Exhibits higher volatility, with multiple peaks and troughs.
- **Key Data Points**:
- Initial error ~1.0 at time step 0.
- First major peak ~4.0 at ~time step 100.
- Second peak ~3.0 at ~time step 200.
- Final spike to ~8.0 at ~time step 400.
- **Anomalies**: Sharp increase at the end (time step 400), suggesting a potential outlier or system instability.
2. **MISRP (Red Solid Line)**:
- **Trend**: More stable, with smaller fluctuations compared to SC/E.
- **Key Data Points**:
- Initial error ~1.5 at time step 0.
- Peaks ~2.0 at ~time step 100 and ~2.5 at ~time step 200.
- Final error ~4.0 at ~time step 400.
- **Anomalies**: Gradual increase toward the end but remains significantly lower than SC/E.
### Key Observations
- The SC/E series shows **higher mean error** overall, with a **dramatic spike** at the final time step (~8.0).
- The MISRP series demonstrates **lower and more consistent error rates**, with a maximum error of ~4.0.
- Both lines exhibit periodic fluctuations, but SC/E’s variability is more pronounced.
### Interpretation
The graph suggests that **MISRP reduces mean error** compared to the baseline SC/E method, particularly in later time steps. The SC/E’s final spike (~8.0) may indicate a failure mode or external factor not mitigated by MISRP. The red line’s stability implies MISRP provides robustness against error accumulation over time. However, the red line’s error still increases toward the end, hinting at potential limitations in MISRP’s effectiveness under prolonged or extreme conditions. The data underscores the importance of error mitigation strategies in dynamic systems.