## Line Chart: Average Liar Score vs. Head Index
### Overview
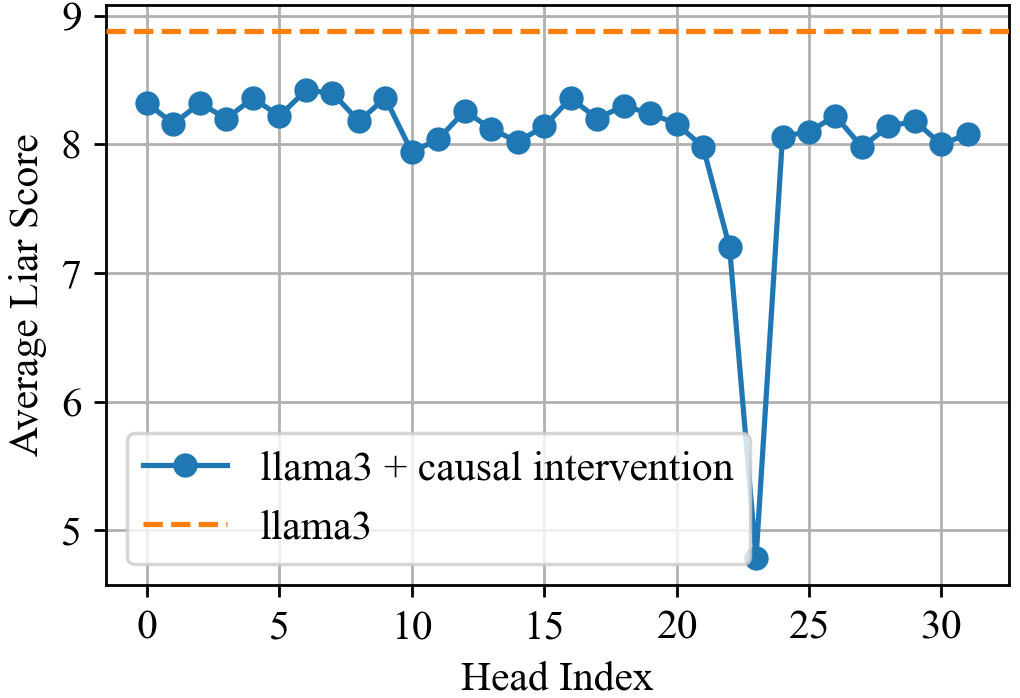
The image is a line chart comparing the average liar score of the Llama3 model with and without causal intervention across different head indices. The x-axis represents the head index, ranging from 0 to 30. The y-axis represents the average liar score, ranging from 5 to 9. The chart displays two data series: "llama3 + causal intervention" (blue line) and "llama3" (orange dashed line).
### Components/Axes
* **X-axis:** Head Index, ranging from 0 to 30 in increments of 5.
* **Y-axis:** Average Liar Score, ranging from 5 to 9 in increments of 1.
* **Legend:** Located in the bottom-left corner.
* Blue line with circle markers: "llama3 + causal intervention"
* Orange dashed line: "llama3"
### Detailed Analysis
* **llama3 + causal intervention (Blue Line):**
* Trend: Generally stable around 8.2-8.4 from head index 0 to 10. A slight dip around head index 10, then recovers to around 8.2. From head index 20, the line sharply decreases, reaching a minimum around head index 24, then sharply increases again, and stabilizes around 8.0-8.2 from head index 25 to 30.
* Data Points:
* Head Index 0: ~8.3
* Head Index 5: ~8.4
* Head Index 10: ~7.9
* Head Index 15: ~8.2
* Head Index 20: ~8.2
* Head Index 23: ~7.2
* Head Index 24: ~4.7
* Head Index 25: ~8.1
* Head Index 30: ~8.1
* **llama3 (Orange Dashed Line):**
* Trend: Constant across all head indices.
* Data Points:
* Average Liar Score: ~8.9
### Key Observations
* The "llama3" model has a consistently high average liar score across all head indices.
* The "llama3 + causal intervention" model shows a significant drop in average liar score around head index 24, indicating a potential vulnerability or sensitivity at that specific head.
* The causal intervention seems to have a generally negative impact on the liar score, except for the specific head index 24 where it drastically reduces the score.
### Interpretation
The chart suggests that causal intervention on the Llama3 model can significantly impact its "liar score," particularly at specific attention heads. The consistent performance of the original Llama3 model (without intervention) provides a baseline for comparison. The sharp drop in the "llama3 + causal intervention" line at head index 24 indicates that intervening at this specific head has a substantial effect on the model's behavior, potentially disrupting its ability to generate deceptive content. The data implies that certain attention heads are more critical than others in maintaining the model's "liar score," and targeted interventions can expose vulnerabilities.