## Line Chart: Average Liar Score vs. Head Index
### Overview
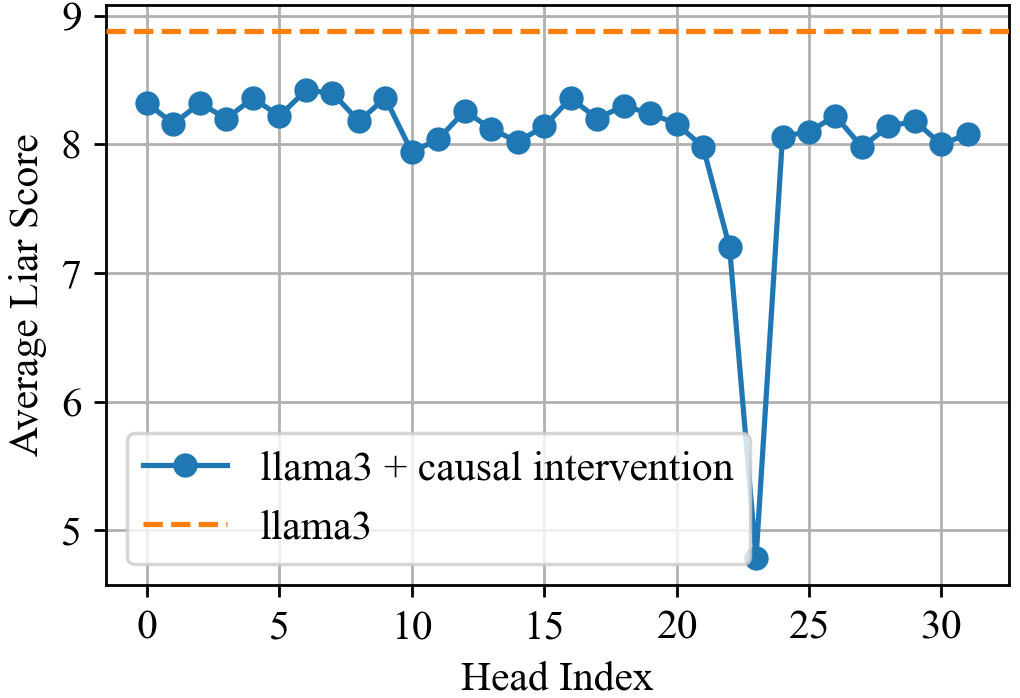
This line chart compares the "Average Liar Score" between two models: "llama3" and "llama3 + causal intervention", across a range of "Head Index" values from 0 to 30. The chart visually demonstrates how the causal intervention impacts the liar score, particularly at higher head indices.
### Components/Axes
* **X-axis:** "Head Index" - ranging from 0 to 30, with tick marks at integer values.
* **Y-axis:** "Average Liar Score" - ranging from approximately 4.5 to 9, with tick marks at integer values.
* **Data Series 1:** "llama3 + causal intervention" - represented by a blue line with circular markers.
* **Data Series 2:** "llama3" - represented by an orange dashed line.
* **Legend:** Located in the bottom-left corner, clearly labeling each data series with its corresponding color.
### Detailed Analysis
**llama3 (Orange Dashed Line):**
The "llama3" line is horizontal and remains relatively constant across all "Head Index" values. The average liar score is approximately 9.0.
**llama3 + causal intervention (Blue Line with Markers):**
The "llama3 + causal intervention" line exhibits a more dynamic behavior.
* From Head Index 0 to approximately 18, the line fluctuates around an average liar score of approximately 8.3, with some minor variations.
* At Head Index 19, the line begins to descend sharply.
* At Head Index 20, the average liar score drops dramatically to approximately 4.8.
* From Head Index 21 to 24, the line rises again, reaching approximately 7.3 at Head Index 24.
* From Head Index 25 to 30, the line fluctuates between approximately 8.1 and 8.3.
Here's a more detailed breakdown of the "llama3 + causal intervention" data points (approximate values):
* Head Index 0: 8.3
* Head Index 2: 8.4
* Head Index 4: 8.4
* Head Index 5: 8.3
* Head Index 6: 8.2
* Head Index 8: 8.1
* Head Index 9: 8.2
* Head Index 10: 8.3
* Head Index 12: 8.4
* Head Index 14: 8.4
* Head Index 16: 8.3
* Head Index 18: 8.3
* Head Index 19: 7.8
* Head Index 20: 4.8
* Head Index 21: 6.5
* Head Index 22: 7.3
* Head Index 23: 7.8
* Head Index 24: 7.3
* Head Index 25: 8.1
* Head Index 26: 8.3
* Head Index 28: 8.2
* Head Index 30: 8.3
### Key Observations
* The "llama3" model consistently exhibits a high average liar score of approximately 9.
* The "llama3 + causal intervention" model shows a significant reduction in the average liar score around Head Index 20, indicating the intervention's effectiveness in reducing "lying" behavior.
* The intervention appears to have a more pronounced effect at higher head indices.
* The "llama3 + causal intervention" line exhibits fluctuations after the initial drop, suggesting the intervention's effect isn't entirely stable.
### Interpretation
The data suggests that the causal intervention significantly reduces the "Average Liar Score" of the "llama3" model, particularly at higher head indices. This implies that the intervention is successful in mitigating the model's tendency to generate deceptive or untruthful responses. The initial drop at Head Index 20 is a notable outlier, demonstrating a substantial improvement. The subsequent fluctuations could indicate that the intervention's effect is sensitive to specific input conditions or that further refinement is needed to stabilize its performance. The consistent high score of the base "llama3" model serves as a clear baseline, highlighting the positive impact of the causal intervention. The "Head Index" likely represents a specific parameter or configuration within the model, and the intervention's effectiveness may be tied to how this parameter influences the model's behavior.