## Line Graph: Average Liar Score Comparison Between "llama3 + causal intervention" and "llama3"
### Overview
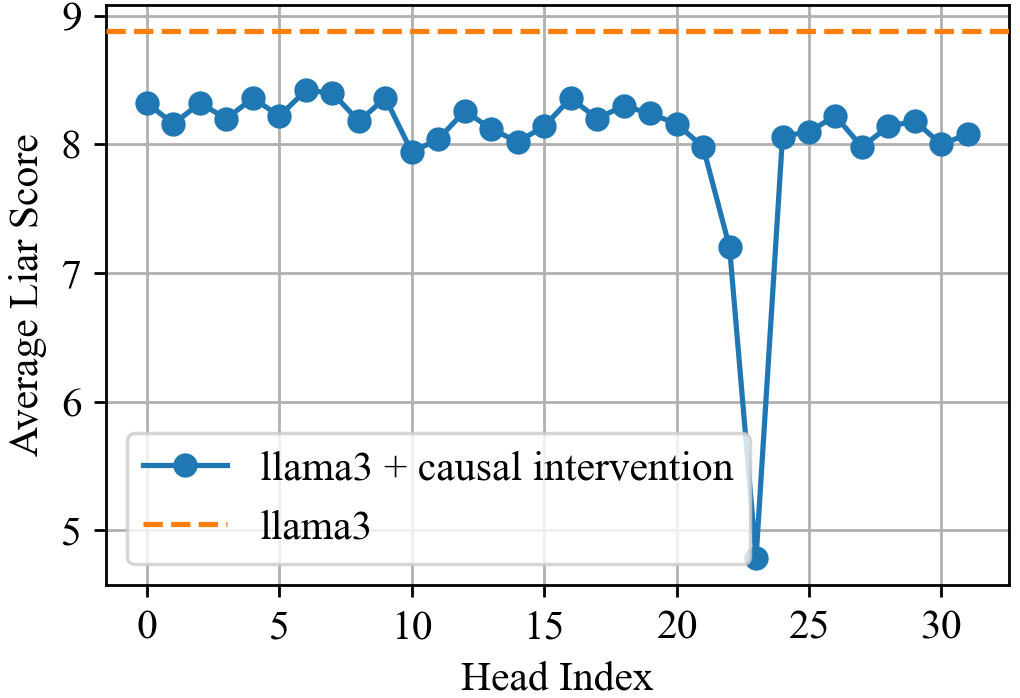
The graph compares two data series across a Head Index range (0–30):
1. **Blue line**: "llama3 + causal intervention" (solid blue circles)
2. **Orange dashed line**: "llama3" (baseline, no intervention)
The y-axis measures "Average Liar Score" (5–9), while the x-axis represents sequential "Head Index" values. A notable anomaly occurs at Head Index 23, where the blue line drops sharply.
---
### Components/Axes
- **X-axis (Head Index)**:
- Range: 0 to 30 (increments of 5)
- Label: "Head Index"
- **Y-axis (Average Liar Score)**:
- Range: 5 to 9 (increments of 1)
- Label: "Average Liar Score"
- **Legend**:
- Position: Bottom-left corner
- Entries:
- Blue solid line: "llama3 + causal intervention"
- Orange dashed line: "llama3"
---
### Detailed Analysis
1. **Baseline ("llama3")**:
- Constant orange dashed line at **8.8** across all Head Index values.
2. **"llama3 + causal intervention" (Blue Line)**:
- **Initial Trend (Head Index 0–22)**:
- Fluctuates between **8.0** and **8.5**, consistently below the baseline (8.8).
- Peaks at **8.5** near Head Index 7.
- **Anomaly (Head Index 23)**:
- Sharp drop to **4.8** (outlier, ~43% decrease from baseline).
- **Recovery (Head Index 24–30)**:
- Rises to **8.0** by Head Index 25, then stabilizes between **8.0–8.2**.
---
### Key Observations
1. The intervention generally reduces the Average Liar Score compared to the baseline.
2. The **Head Index 23 anomaly** is a critical outlier, deviating by ~4 units from the baseline.
3. Post-anomaly recovery suggests partial restoration of the intervention’s effect.
---
### Interpretation
- **Effectiveness of Intervention**:
The blue line’s lower values (8.0–8.5 vs. 8.8 baseline) indicate the intervention typically reduces liar scores. However, the **Head Index 23 anomaly** raises questions:
- Was this a data error, or did the intervention fail catastrophically at this point?
- Could external factors (e.g., measurement noise, contextual shifts) explain the drop?
- **Recovery Pattern**:
The return to near-baseline levels after Head Index 23 suggests the intervention’s impact may be context-dependent or subject to diminishing returns.
- **Baseline Stability**:
The orange dashed line’s consistency (8.8) implies "llama3" without intervention maintains a stable, higher liar score.
---
### Spatial Grounding & Verification
- **Legend Accuracy**:
- Blue circles match the "llama3 + causal intervention" label.
- Orange dashes align with the "llama3" baseline.
- **Trend Verification**:
- Blue line slopes downward at Head Index 23, confirming the anomaly.
- Post-23 recovery aligns with a gradual upward trend.
---
### Content Details
- **Notable Data Points**:
- Head Index 23: **4.8** (blue line) vs. **8.8** (baseline).
- Head Index 7: **8.5** (peak for blue line).
- **Axis Markers**:
- Gridlines at every integer value for both axes.
---
### Final Notes
The graph highlights the intervention’s general efficacy but underscores the need to investigate the Head Index 23 anomaly. The recovery post-dip suggests resilience in the intervention’s design, though the outlier warrants further scrutiny.