\n
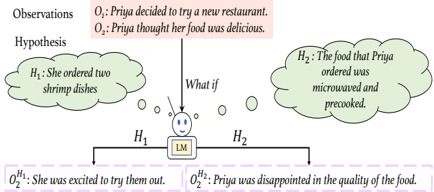
## Diagram: Hypothesis Testing in Narrative Reasoning
### Overview
The image is a conceptual diagram illustrating a logical reasoning process where initial observations lead to competing hypotheses, which in turn generate different predicted outcomes. It visually maps how the same set of facts can support divergent interpretations based on different assumptions.
### Components/Axes
The diagram is structured with labeled text boxes and thought bubbles connected by arrows. There are no numerical axes or data points.
**1. Observations (Top-Left, Pink Background):**
* **Label:** `Observations`
* **Content:**
* `O₁: Priya decided to try a new restaurant.`
* `O₂: Priya thought her food was delicious.`
**2. Hypotheses (Center, Green Thought Bubbles):**
* **Label:** `Hypothesis`
* **H₁ (Left Bubble):** `H₁: She ordered two shrimp dishes.`
* **H₂ (Right Bubble):** `H₂: The food that Priya ordered was microwaved and precooked.`
* **Connector:** An arrow labeled `What if` points from the `Observations` box to the `H₂` bubble.
**3. Reasoning Engine (Center, Yellow Box):**
* A box labeled `LM` (likely standing for "Language Model" or "Logic Module") sits between the hypotheses and the outcomes. Arrows from `H₁` and `H₂` point into this box.
**4. Predicted Outcomes (Bottom, Purple Background):**
* **O₂^{H₁} (Left):** `O₂^{H₁}: She was excited to try them out.`
* **O₂^{H₂} (Right):** `O₂^{H₂}: Priya was disappointed in the quality of the food.`
* Arrows from the `LM` box point to these respective outcomes.
### Detailed Analysis
The diagram presents a clear, linear flow of reasoning:
1. **Starting Point:** Two established facts (Observations O₁ and O₂) about Priya's restaurant experience.
2. **Hypothesis Generation:** Two different hypotheses are proposed to explain or contextualize these observations.
* `H₁` is a neutral, factual hypothesis about her order.
* `H₂` is introduced via a "What if" prompt, proposing a negative quality about the food preparation.
3. **Inference Process:** Both hypotheses are processed by a central reasoning unit (`LM`).
4. **Divergent Conclusions:** The same initial observation (`O₂: ...food was delicious`) leads to two contradictory predicted outcomes based on the intervening hypothesis:
* Under `H₁`, the outcome is positive (`excited`).
* Under `H₂`, the outcome is negative (`disappointed`).
### Key Observations
* **Color-Coding:** The diagram uses color to categorize elements: pink for ground-truth observations, green for hypothetical propositions, yellow for the processing unit, and purple for derived outcomes.
* **Logical Notation:** The outcomes use superscript notation (`O₂^{H₁}`) to denote that these are interpretations of observation `O₂` *conditional on* hypothesis `H₁` or `H₂`.
* **Spatial Layout:** The flow is top-to-bottom, with the central `LM` box acting as a pivot point. The competing hypotheses are placed symmetrically on either side, visually emphasizing their alternative nature.
* **Textual Content:** All text is in English. The language is simple, narrative, and focused on a single character's experience.
### Interpretation
This diagram is a model of **abductive reasoning** or **inference to the best explanation**. It demonstrates how the same piece of evidence (Priya finding the food delicious) can be interpreted in fundamentally different ways depending on the background assumption (hypothesis) one adopts.
* **What it suggests:** The diagram argues that facts alone (`Observations`) are insufficient to determine a narrative's meaning. The interpreter's hypothesis (`H₁` vs. `H₂`) acts as a lens that completely inverts the valence of the outcome—from positive excitement to negative disappointment.
* **Relationship between elements:** The `LM` represents the cognitive or computational process that applies a hypothesis to facts to generate a prediction. The "What if" arrow is critical, as it shows how introducing an alternative, unfalsifiable hypothesis (`H₂`) can destabilize a straightforward interpretation.
* **Notable Anomaly/Insight:** The core insight is the **contradiction between O₂ and O₂^{H₂}**. The initial observation states the food was "delicious," yet the hypothesis-driven outcome is "disappointed in the quality." This highlights that "delicious" might be a superficial or initial reaction, while "quality" (as defined by `H₂`'s focus on preparation method) is a deeper, evaluative judgment. The diagram thus explores the gap between subjective experience and objective assessment.