## Hypothesis Testing Diagram
### Overview
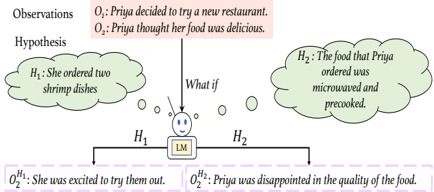
The diagram illustrates a hypothesis testing scenario involving a person named Priya. It presents two hypotheses (H1 and H2) and two observations (O1 and O2) to determine which hypothesis is more likely to be true.
### Components/Axes
- **Hypothesis (H1)**: Priya ordered two shrimp dishes.
- **Hypothesis (H2)**: Priya ordered microwaved and precooked food.
- **Observation (O1)**: Priya decided to try a new restaurant.
- **Observation (O2)**: Priya thought her food was delicious.
- **What if**: This is a placeholder for the decision-making process.
- **LM**: This could represent a logical model or a decision-making framework.
- **Hypothesis (H2)**: Priya was disappointed in the quality of the food.
### Detailed Analysis or ### Content Details
- **Hypothesis (H1)**: Priya ordered two shrimp dishes.
- **Hypothesis (H2)**: Priya ordered microwaved and precooked food.
- **Observation (O1)**: Priya decided to try a new restaurant.
- **Observation (O2)**: Priya thought her food was delicious.
- **What if**: This is a placeholder for the decision-making process.
- **LM**: This could represent a logical model or a decision-making framework.
- **Hypothesis (H2)**: Priya was disappointed in the quality of the food.
### Key Observations
- **O1**: Priya decided to try a new restaurant.
- **O2**: Priya thought her food was delicious.
- **H2**: Priya was disappointed in the quality of the food.
### Interpretation
The diagram suggests that Priya's decision to try a new restaurant and her positive feedback about her food (O1 and O2) are more consistent with the hypothesis that she ordered microwaved and precooked food (H2) rather than shrimp dishes (H1). The disappointment in the quality of the food (H2) is less likely to be explained by the positive feedback about her food. Therefore, the logical model (LM) suggests that Priya was more likely to have ordered microwaved and precooked food.