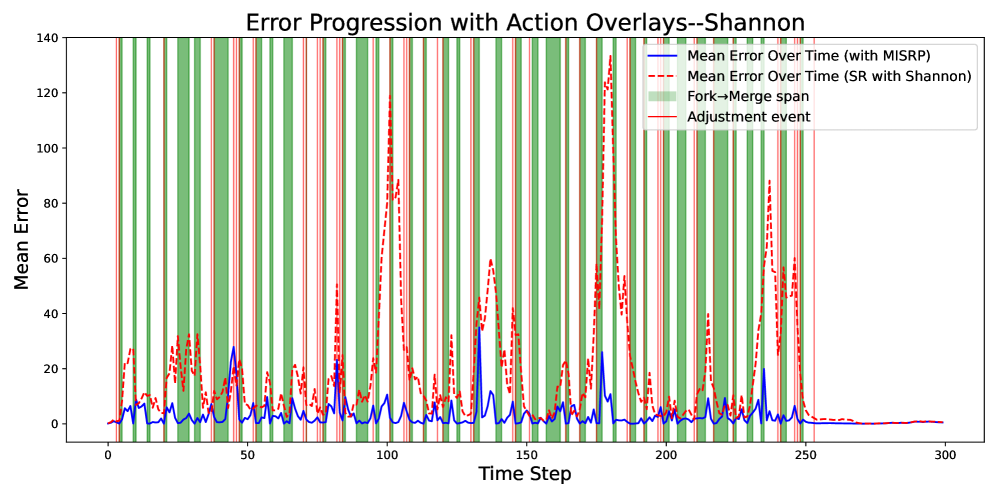
## Line Chart: Error Progression with Action Overlays--Shannon
### Overview
This chart displays the progression of mean error over time, with overlays indicating the occurrence of "Fork->Merge span" and "Adjustment event" actions. Two error curves are presented: one representing the mean error over time with MISRP, and the other representing the mean error over time with Shannon. The chart spans from Time Step 0 to approximately 300.
### Components/Axes
* **Title:** Error Progression with Action Overlays--Shannon
* **X-axis:** Time Step (ranging from 0 to approximately 300)
* **Y-axis:** Mean Error (ranging from 0 to 140)
* **Legend:**
* Blue Solid Line: Mean Error Over Time (with MISRP)
* Red Dashed Line: Mean Error Over Time (with SR with Shannon)
* Green Vertical Bands: Fork->Merge span
* Teal Vertical Bands: Adjustment event
### Detailed Analysis
The chart presents three distinct visual elements: two error curves and two types of vertical bands representing actions.
**Mean Error Over Time (with MISRP) - Blue Solid Line:**
The blue line generally fluctuates close to the x-axis (Mean Error = 0) for the first 150 time steps, with occasional spikes. Around Time Step 150, the line exhibits a more pronounced upward trend, peaking at approximately 10 at Time Step 160, then returning to low values. After Time Step 200, the line remains relatively stable, fluctuating between 0 and 5.
* Time Step 0: Mean Error ≈ 2
* Time Step 25: Mean Error ≈ 4
* Time Step 50: Mean Error ≈ 3
* Time Step 75: Mean Error ≈ 5
* Time Step 100: Mean Error ≈ 6
* Time Step 125: Mean Error ≈ 8
* Time Step 150: Mean Error ≈ 10
* Time Step 175: Mean Error ≈ 4
* Time Step 200: Mean Error ≈ 2
* Time Step 225: Mean Error ≈ 3
* Time Step 250: Mean Error ≈ 1
* Time Step 275: Mean Error ≈ 2
**Mean Error Over Time (with SR with Shannon) - Red Dashed Line:**
The red dashed line shows significantly higher error values compared to the blue line. It fluctuates considerably, with frequent spikes reaching up to approximately 130. The line exhibits a generally upward trend, with periods of relative stability interspersed with rapid increases in error.
* Time Step 0: Mean Error ≈ 10
* Time Step 25: Mean Error ≈ 15
* Time Step 50: Mean Error ≈ 20
* Time Step 75: Mean Error ≈ 25
* Time Step 100: Mean Error ≈ 30
* Time Step 125: Mean Error ≈ 40
* Time Step 150: Mean Error ≈ 50
* Time Step 175: Mean Error ≈ 60
* Time Step 200: Mean Error ≈ 70
* Time Step 225: Mean Error ≈ 80
* Time Step 250: Mean Error ≈ 90
* Time Step 275: Mean Error ≈ 100
**Fork->Merge span - Green Vertical Bands:**
These bands appear frequently throughout the chart, particularly between Time Step 0 and 250. They are relatively wide and cover a significant portion of the chart.
**Adjustment event - Teal Vertical Bands:**
These bands are less frequent than the green bands and appear more sporadically, primarily after Time Step 200. They are narrower than the green bands.
### Key Observations
* The "SR with Shannon" method consistently exhibits higher mean error values than the "MISRP" method.
* The "Fork->Merge span" action appears to correlate with increased error, particularly for the "SR with Shannon" method.
* The "Adjustment event" action seems to occur less frequently and its impact on error is less pronounced than the "Fork->Merge span" action.
* The error with MISRP is generally low and stable, while the error with SR with Shannon is high and volatile.
### Interpretation
The chart suggests that the "MISRP" method is more effective at maintaining low error rates compared to the "SR with Shannon" method. The frequent occurrence of "Fork->Merge span" actions, coupled with the higher error values associated with "SR with Shannon", indicates that this action may be a source of instability or error in the system. The "Adjustment event" action, while present, appears to have a less significant impact on error.
The data implies a trade-off between the frequency of "Fork->Merge span" actions and the resulting error. The system may benefit from reducing the frequency of these actions or implementing strategies to mitigate their impact on error. The consistent low error of MISRP suggests it is a more robust approach, but further investigation is needed to understand why "SR with Shannon" is more susceptible to error during "Fork->Merge span" events. The chart provides a visual representation of the performance of two different methods and highlights the potential impact of specific actions on system error.