## Line Graph: Error Progression with Action Overlays--Shannon
### Overview
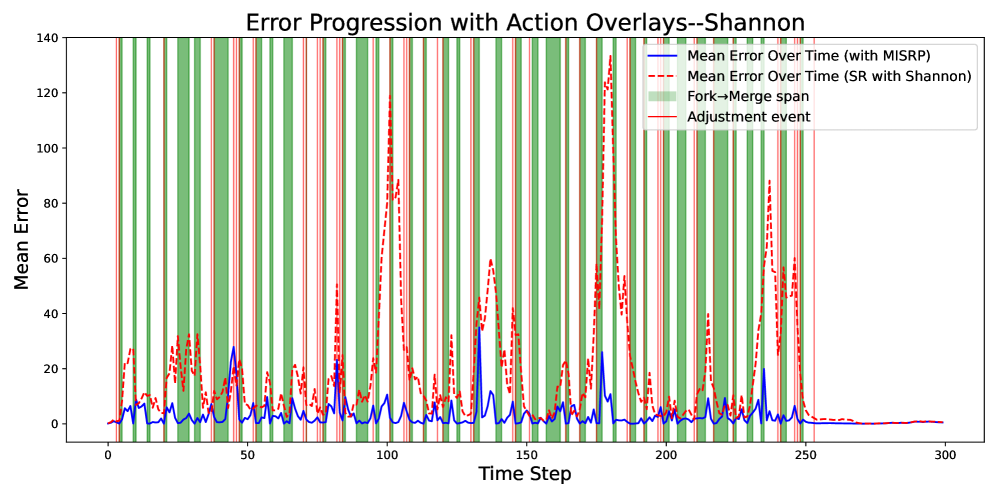
The graph visualizes the progression of mean error over time for two systems: one using MISRP (solid blue line) and another using Shannon-based SR (dashed red line). It includes annotations for "Fork→Merge span" (green vertical bars) and "Adjustment event" (red vertical bars). The x-axis represents time steps (0–300), and the y-axis represents mean error (0–140).
---
### Components/Axes
- **X-axis (Time Step)**: Labeled "Time Step," ranging from 0 to 300 in increments of 50.
- **Y-axis (Mean Error)**: Labeled "Mean Error," ranging from 0 to 140 in increments of 20.
- **Legend**: Located in the top-right corner, with four entries:
- Solid blue line: "Mean Error Over Time (with MISRP)"
- Dashed red line: "Mean Error Over Time (SR with Shannon)"
- Green vertical bars: "Fork→Merge span"
- Red vertical bars: "Adjustment event"
---
### Detailed Analysis
1. **Mean Error Over Time (MISRP)**:
- Solid blue line with small fluctuations.
- Peaks at ~30 (time step 100) and ~25 (time step 200).
- Remains below 10 for most of the timeline, stabilizing near 0 after time step 250.
2. **Mean Error Over Time (SR with Shannon)**:
- Dashed red line with significant volatility.
- Peaks at ~120 (time step 100) and ~80 (time step 250).
- Frequently exceeds 40, with sharp spikes during adjustment events.
3. **Fork→Merge Span**:
- Green vertical bars span the entire y-axis (0–140) at irregular intervals.
- Occur ~10–15 times, with durations of ~10–20 time steps.
- Correlate with spikes in the red line (SR with Shannon).
4. **Adjustment Event**:
- Red vertical bars span ~20–30 units on the y-axis.
- Occur ~5–7 times, aligned with peaks in the red line.
- Appear to mitigate error spikes but are less effective for the Shannon method.
---
### Key Observations
- **Error Volatility**: The Shannon-based SR method exhibits ~4–5x higher mean error than MISRP during peaks.
- **Temporal Correlation**: Fork→Merge spans align with error spikes in the Shannon method, suggesting systemic stress during these periods.
- **Adjustment Efficacy**: Adjustment events reduce errors for MISRP but have limited impact on the Shannon method, which experiences persistent high errors post-event.
---
### Interpretation
The data demonstrates that the MISRP system maintains lower, more stable errors compared to the Shannon-based SR method. Fork→Merge spans likely represent periods of high system activity or complexity, which disproportionately affect the Shannon method. Adjustment events partially mitigate errors but fail to address the root cause of volatility in the Shannon approach. This suggests that the Shannon method may require architectural improvements to handle dynamic workloads, whereas MISRP’s stability indicates robustness in error management. The red line’s persistent spikes after adjustment events highlight a critical limitation in the Shannon-based system’s adaptability.