## Composite Line Graphs: Model Training Performance Across Optimizer Steps
### Overview
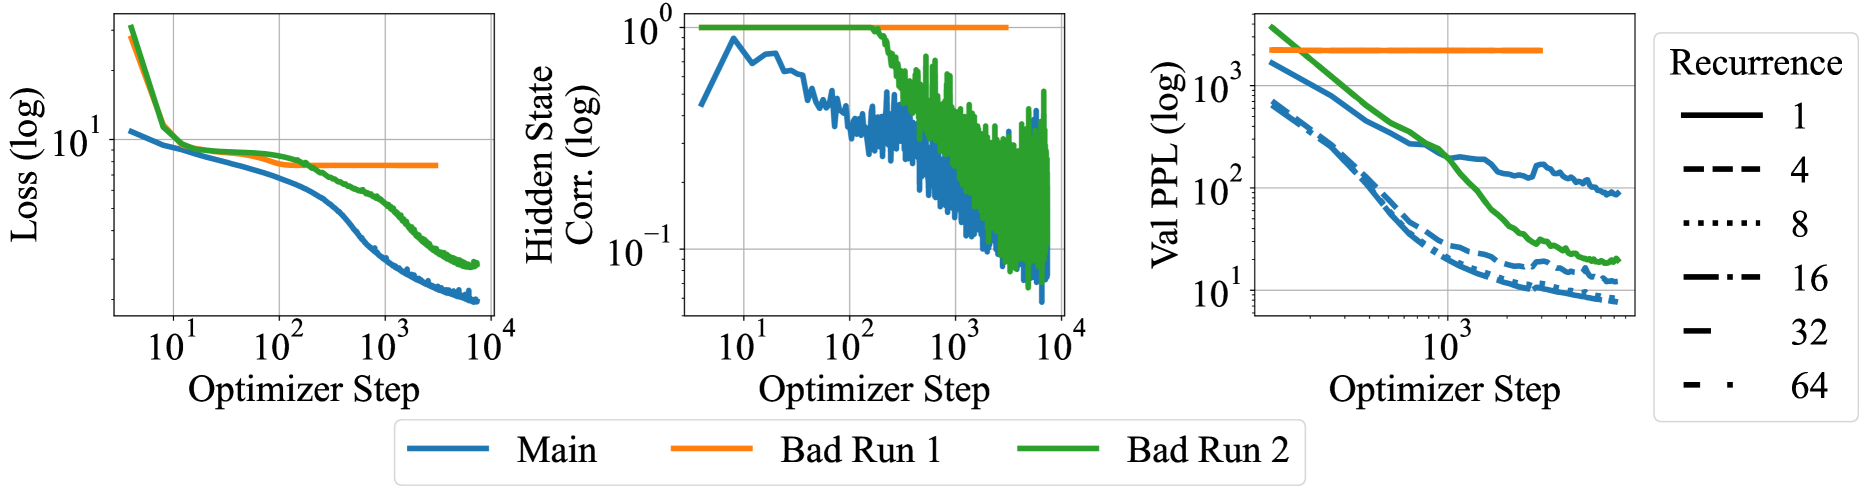
The image contains three side-by-side line graphs comparing model training metrics across optimizer steps. Each graph tracks different performance indicators (loss, hidden state correlation, validation perplexity) with three data series: "Main" (blue), "Bad Run 1" (orange), and "Bad Run 2" (green). The rightmost graph additionally shows recurrence level variations (1-64) through line style variations.
### Components/Axes
1. **Left Graph (Loss vs Optimizer Step)**
- **Y-axis**: Loss (log scale, 10¹ to 10⁴)
- **X-axis**: Optimizer Step (10¹ to 10⁴)
- **Legend**:
- Blue: Main
- Orange: Bad Run 1
- Green: Bad Run 2
2. **Middle Graph (Hidden State Correlation vs Optimizer Step)**
- **Y-axis**: Hidden State Corr. (log scale, 10⁻¹ to 10⁰)
- **X-axis**: Optimizer Step (10¹ to 10⁴)
- **Legend**: Same color coding as left graph
3. **Right Graph (Validation Perplexity vs Optimizer Step)**
- **Y-axis**: Val PPL (log scale, 10¹ to 10³)
- **X-axis**: Optimizer Step (10¹ to 10⁴)
- **Recurrence Levels**:
- Solid line: 1
- Dashed line: 4
- Dotted line: 8
- Dash-dot line: 16
- Double-dot line: 32
- Triple-dot line: 64
### Detailed Analysis
**Left Graph (Loss)**
- **Main (blue)**: Starts at ~10³ loss, decreases exponentially to ~10¹ by 10³ steps, then plateaus
- **Bad Run 1 (orange)**: Flat line at ~10² loss throughout
- **Bad Run 2 (green)**: Starts at ~10³ loss, decreases to ~10² by 10³ steps, then plateaus
**Middle Graph (Hidden State Correlation)**
- **Main (blue)**: Fluctuates between 10⁻¹ and 10⁰ with no clear trend
- **Bad Run 1 (orange)**: Flat line at ~10⁻¹
- **Bad Run 2 (green)**: Starts at ~10⁻¹, drops to 10⁻² by 10² steps, then fluctuates
**Right Graph (Validation Perplexity)**
- **Main (blue)**: Decreases from ~10³ to ~10² over 10³ steps, then plateaus
- **Bad Run 1 (orange)**: Flat line at ~10³
- **Bad Run 2 (green)**: Decreases from ~10³ to ~10² over 10³ steps, then plateaus
- **Recurrence Variations**: All recurrence levels show similar decreasing trends, with higher recurrence levels (32-64) maintaining lower perplexity longer
### Key Observations
1. **Performance Divergence**: Main consistently outperforms Bad Runs in all metrics
2. **Training Stability**: Bad Run 1 shows catastrophic forgetting (flat loss/perplexity), while Bad Run 2 demonstrates partial recovery
3. **Recurrence Impact**: Higher recurrence levels (16-64) maintain better validation performance longer
4. **Log Scale Patterns**: All metrics show exponential decay trends when plotted on log scales
### Interpretation
The data reveals critical insights about model training dynamics:
- **Main Series**: Demonstrates ideal training behavior with consistent loss reduction and stable hidden state correlations
- **Bad Runs**: Highlight failure modes - Bad Run 1 shows complete training collapse, while Bad Run 2 exhibits partial recovery suggesting unstable optimization
- **Recurrence Tradeoff**: Higher recurrence levels improve validation performance but may increase computational costs
- **Optimization Sensitivity**: Small architectural changes (recurrence levels) significantly impact training stability
The graphs emphasize the importance of hyperparameter tuning and architectural choices in transformer-based models, particularly regarding recurrence depth and optimizer configuration.