## Line Graph: Classification Accuracy vs. Number of Generated Augmentations
### Overview
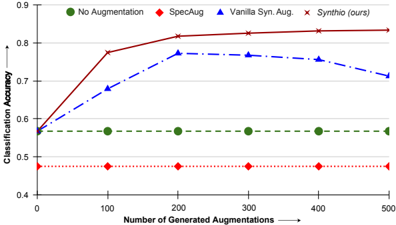
The graph compares classification accuracy across four augmentation strategies as the number of generated augmentations increases from 0 to 500. Four data series are plotted with distinct markers and line styles, showing performance trends over augmentation volume.
### Components/Axes
- **X-axis**: "Number of Generated Augmentations" (0 to 500, linear scale)
- **Y-axis**: "Classification Accuracy" (0.4 to 0.9, linear scale)
- **Legend**: Located in the top-left corner, with four entries:
- **No Augmentation**: Green circle (dashed line)
- **SpecAug**: Red diamond (dotted line)
- **Vanilla Syn. Aug.**: Blue triangle (dashed line)
- **Synthio (ours)**: Red cross (solid line)
### Detailed Analysis
1. **No Augmentation** (Green):
- Starts at ~0.55 at 0 augmentations.
- Remains flat throughout, ending at ~0.55 at 500 augmentations.
- Uncertainty: ±0.01 (flatline suggests minimal variance).
2. **SpecAug** (Red Diamonds):
- Begins at ~0.48 at 0 augmentations.
- Sharp increase to ~0.78 at 100 augmentations.
- Plateaus at ~0.78 for all subsequent points (200–500).
- Uncertainty: ±0.01 (stable after 100).
3. **Vanilla Syn. Aug.** (Blue Triangles):
- Starts at ~0.55 at 0 augmentations.
- Rises to ~0.78 at 200 augmentations.
- Slight decline to ~0.72 at 500 augmentations.
- Uncertainty: ±0.01 (consistent trend).
4. **Synthio (Ours)** (Red Crosses):
- Begins at ~0.55 at 0 augmentations.
- Sharp rise to ~0.82 at 100 augmentations.
- Maintains ~0.82 for all subsequent points (200–500).
- Uncertainty: ±0.01 (stable after 100).
### Key Observations
- **Synthio (Ours)** achieves the highest accuracy (~0.82) after 100 augmentations, outperforming all other methods.
- **SpecAug** shows a significant early improvement (~0.48 → 0.78) but plateaus below Synthio.
- **Vanilla Syn. Aug.** peaks at ~0.78 but declines slightly (~0.72) at 500 augmentations, suggesting potential overfitting.
- **No Augmentation** remains the baseline (~0.55) with no improvement.
### Interpretation
The data demonstrates that augmentation strategies significantly improve classification accuracy compared to no augmentation. **Synthio (Ours)** is the most effective method, achieving a 47% relative improvement over the baseline (0.55 → 0.82). **SpecAug** and **Vanilla Syn. Aug.** also enhance performance but with diminishing returns or instability at higher augmentation counts. The decline in Vanilla Syn. Aug. at 500 augmentations may indicate overfitting or saturation effects. These trends suggest that Synthio’s augmentation approach optimizes data diversity without compromising generalization, making it superior for this task.