## Scatter and Distribution Plots: Affirmative and Negated Statements
### Overview
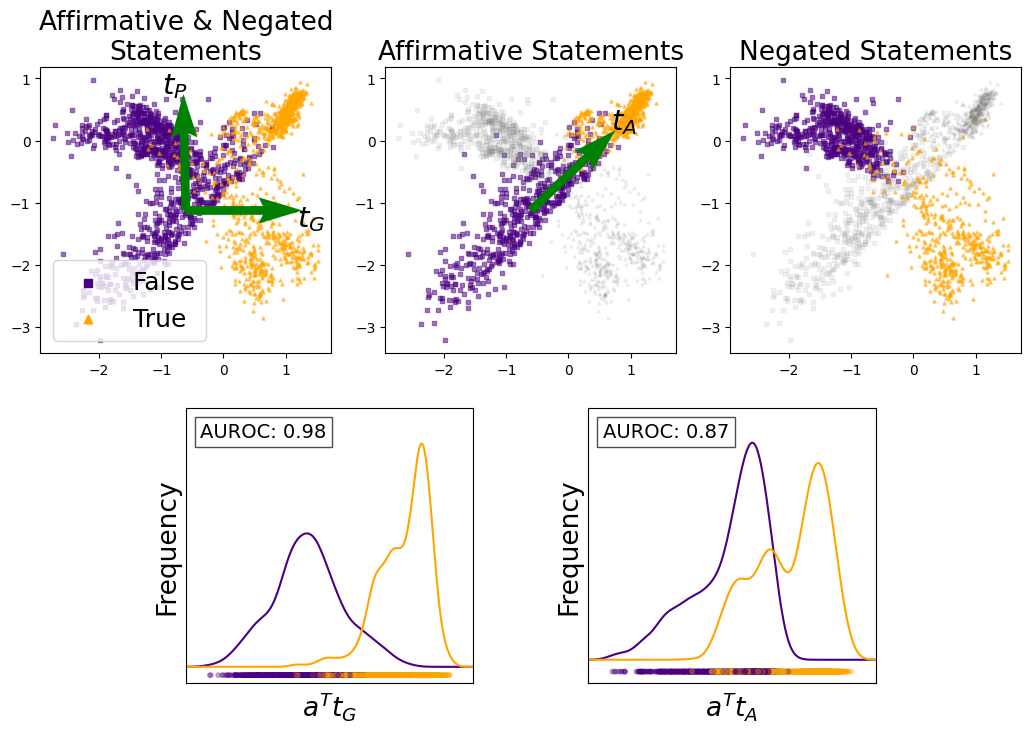
The image presents three scatter plots and two distribution plots. The scatter plots visualize the distribution of data points, categorized as "False" (purple squares) and "True" (orange triangles), under different conditions: "Affirmative & Negated Statements," "Affirmative Statements," and "Negated Statements." Green arrows labeled *t<sub>P</sub>*, *t<sub>G</sub>*, and *t<sub>A</sub>* are overlaid on the scatter plots. The distribution plots show the frequency of data along the x-axis, which represents *a<sup>T</sup>t<sub>G</sub>* and *a<sup>T</sup>t<sub>A</sub>*, with purple and orange lines corresponding to "False" and "True" categories, respectively. AUROC values are provided for each distribution plot.
### Components/Axes
**Scatter Plots (Top Row):**
* **Title 1 (Top-Left):** Affirmative & Negated Statements
* **Title 2 (Top-Middle):** Affirmative Statements
* **Title 3 (Top-Right):** Negated Statements
* **X-axis:** Ranges from approximately -2 to 1 in all three plots.
* **Y-axis:** Ranges from approximately -3 to 1 in all three plots.
* **Legend (Top-Left Plot):**
* False: Represented by purple squares.
* True: Represented by orange triangles.
* **Arrows:**
* Top-Left Plot: Green arrows labeled *t<sub>P</sub>* (pointing upwards) and *t<sub>G</sub>* (pointing right).
* Top-Middle Plot: Green arrow labeled *t<sub>A</sub>* (pointing up and to the right).
**Distribution Plots (Bottom Row):**
* **Title 1 (Bottom-Left):** AUROC: 0.98
* **Title 2 (Bottom-Right):** AUROC: 0.87
* **X-axis (Bottom-Left):** *a<sup>T</sup>t<sub>G</sub>*
* **X-axis (Bottom-Right):** *a<sup>T</sup>t<sub>A</sub>*
* **Y-axis:** Frequency
### Detailed Analysis
**Scatter Plots:**
* **Affirmative & Negated Statements (Top-Left):**
* "False" (purple squares) are concentrated in the top-left and bottom-left quadrants.
* "True" (orange triangles) are concentrated in the top-right and bottom-right quadrants.
* **Affirmative Statements (Top-Middle):**
* "False" (purple squares) are concentrated in the bottom-left quadrant.
* "True" (orange triangles) are concentrated in the top-right quadrant.
* Gray data points are present in the top-left and bottom-right quadrants.
* **Negated Statements (Top-Right):**
* "False" (purple squares) are concentrated in the top-left quadrant.
* "True" (orange triangles) are concentrated in the bottom-right quadrant.
* Gray data points are present in the top-right and bottom-left quadrants.
**Distribution Plots:**
* **AUROC: 0.98 (Bottom-Left):**
* The purple line (False) shows a peak around -0.5 on the x-axis.
* The orange line (True) shows a peak around 0.5 on the x-axis.
* **AUROC: 0.87 (Bottom-Right):**
* The purple line (False) shows a peak around -0.25 on the x-axis.
* The orange line (True) shows a peak around 0.25 on the x-axis.
### Key Observations
* The scatter plots show distinct clustering of "False" and "True" data points in different quadrants, depending on the statement type (Affirmative, Negated, or both).
* The distribution plots show the frequency of data points along the x-axis, with distinct peaks for "False" and "True" categories.
* The AUROC values indicate the performance of the classification, with 0.98 for "Affirmative & Negated Statements" and 0.87 for "Affirmative Statements."
### Interpretation
The image illustrates the distribution of data points representing "False" and "True" statements under different conditions. The scatter plots provide a visual representation of how these statements are clustered in a two-dimensional space. The distribution plots quantify the separation between "False" and "True" statements, with higher AUROC values indicating better separation. The green arrows likely represent vectors or directions of importance in the data. The gray data points in the "Affirmative Statements" and "Negated Statements" plots might represent neutral or ambiguous statements. The data suggests that affirmative and negated statements have different distributions, and the model performs better at distinguishing between "False" and "True" statements when both affirmative and negated statements are considered.