## Scatter Plots & Histograms: Affirmative & Negated Statements Analysis
### Overview
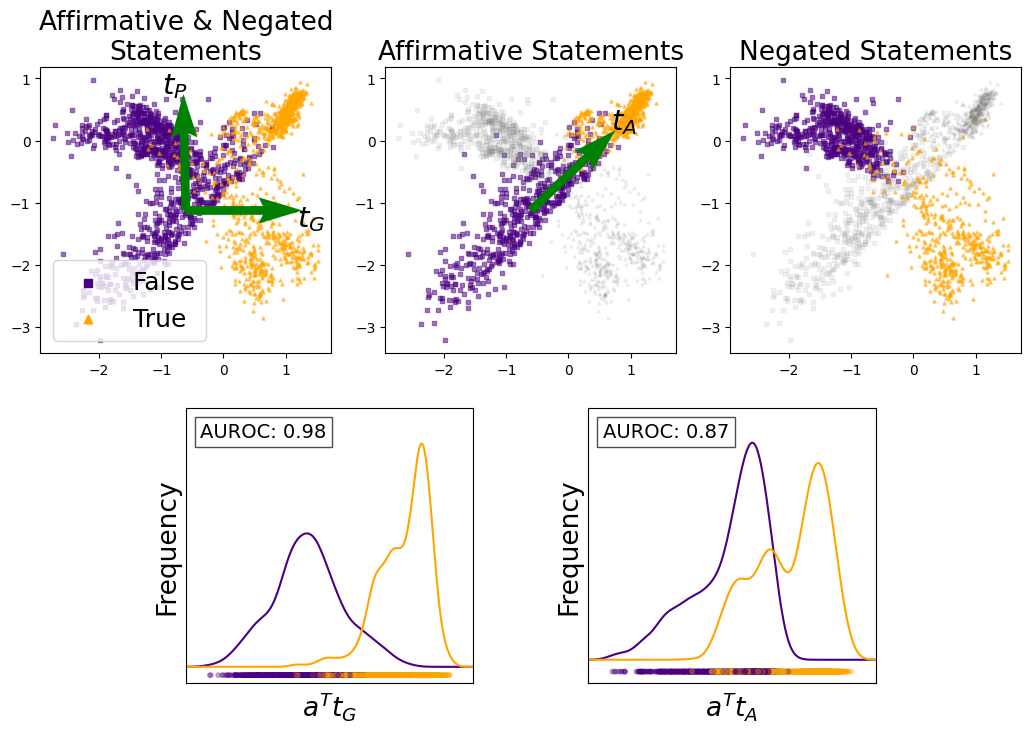
The image presents a comparative analysis of affirmative and negated statements using scatter plots and histograms. Three scatter plots are arranged horizontally, representing "Affirmative & Negated Statements", "Affirmative Statements", and "Negated Statements" respectively. Below these are two histograms, corresponding to the "Affirmative & Negated Statements" and "Negated Statements" scatter plots. The plots appear to visualize a classification or discrimination task, potentially related to truth value assessment.
### Components/Axes
* **Scatter Plots:**
* X-axis: Ranges approximately from -2.5 to 1.5. No explicit label is provided, but it likely represents a feature or score.
* Y-axis: Ranges approximately from -3.5 to 1.2. No explicit label is provided, but it likely represents a feature or score.
* Points: Represent individual statements.
* Colors:
* Purple: Indicates "False" statements (in the first scatter plot).
* Orange: Indicates "True" statements (in the first scatter plot).
* Grey: Represents all statements in the "Affirmative Statements" and "Negated Statements" plots.
* Arrows:
* `t_G`: Green arrow in the first plot, pointing from the lower-left towards the upper-right.
* `t_P`: Orange arrow in the first plot, pointing from the lower-left towards the upper-right.
* `t_A`: Purple arrow in the second plot, pointing from the lower-left towards the upper-right.
* **Histograms:**
* X-axis: Labeled as `a^T t_G` (left histogram) and `a^T t_A` (right histogram). These likely represent scores or projections.
* Y-axis: Labeled as "Frequency".
* Colors: Represent the distribution of scores. The color gradient ranges from purple to orange.
* **Title:** "Affirmative & Negated Statements" (above the plots).
* **Legends:** "False" (purple square) and "True" (orange triangle) in the bottom-left of the first scatter plot.
* **AUROC Scores:** "AUROC: 0.98" (below the left histogram) and "AUROC: 0.87" (below the right histogram).
### Detailed Analysis or Content Details
* **Scatter Plot 1 (Affirmative & Negated Statements):**
* The purple ("False") points are concentrated in the lower-left quadrant.
* The orange ("True") points are concentrated in the upper-right quadrant.
* The green arrow (`t_G`) and orange arrow (`t_P`) both point in a similar direction, suggesting a common discriminating feature.
* **Scatter Plot 2 (Affirmative Statements):**
* The grey points are distributed across the plot, with a higher density in the lower-left quadrant.
* The purple arrow (`t_A`) points from the lower-left towards the upper-right.
* **Scatter Plot 3 (Negated Statements):**
* The grey points are distributed across the plot, with a higher density in the lower-left quadrant.
* **Histogram 1 (a^T t_G):**
* The histogram shows a bimodal distribution.
* There is a peak around -0.5 (purple) and a peak around 0.7 (orange).
* **Histogram 2 (a^T t_A):**
* The histogram shows a unimodal distribution, skewed to the right.
* The peak is around 0.3 (purple/orange).
* **AUROC Scores:**
* The AUROC score for the "Affirmative & Negated Statements" is 0.98, indicating excellent discrimination performance.
* The AUROC score for the "Negated Statements" is 0.87, indicating good discrimination performance, but lower than the first case.
### Key Observations
* The first scatter plot demonstrates a clear separation between "False" and "True" statements based on the two features represented by the axes.
* The AUROC score of 0.98 suggests a highly effective classifier for distinguishing between true and false statements when considering both affirmative and negated statements.
* The histograms reveal different distributions of scores for the two cases, potentially indicating different underlying mechanisms for truth assessment in affirmative vs. negated statements.
* The `t_G` and `t_P` arrows in the first scatter plot suggest that the same discriminating feature is used for both true and false statements.
### Interpretation
The data suggests a method for classifying statements as true or false based on a feature space defined by the x and y axes. The high AUROC score (0.98) for the combined affirmative and negated statements indicates that the chosen features and classification method are highly effective. The lower AUROC score (0.87) for negated statements suggests that negation introduces complexity, potentially requiring different features or a more sophisticated classification approach. The histograms provide insight into the distribution of scores for each case, revealing that the scores for affirmative and negated statements are distributed differently. The arrows (`t_G`, `t_P`, `t_A`) likely represent the direction of maximum separation between the true and false statements, indicating the most important feature for discrimination. The bimodal distribution in the first histogram suggests a clear separation between the scores for true and false statements, while the unimodal distribution in the second histogram suggests a more gradual transition. This analysis could be applied to natural language processing tasks such as fact verification or sentiment analysis.