TECHNICAL ASSET FINGERPRINT
15d62fe469183664f9f1489d
Click to view fullscreen
Press ESC or click to close
FOUND IN PAPERS
EXPERT: healer-alpha-free VERSION 1
RUNTIME: free/openrouter/healer-alpha
INTEL_VERIFIED
## Scatter Plots and Histograms: Analysis of Affirmative and Negated Statements
### Overview
The image is a composite figure containing five plots arranged in two rows. The top row consists of three scatter plots visualizing data points in a 2D space, labeled "Affirmative & Negated Statements," "Affirmative Statements," and "Negated Statements." The bottom row contains two histogram plots showing frequency distributions. The overall theme appears to be an analysis of how a model or system distinguishes between "True" and "False" statements, possibly in the context of natural language processing or logical reasoning, using vector projections.
### Components/Axes
**Top Row - Scatter Plots:**
* **Titles:** "Affirmative & Negated Statements" (left), "Affirmative Statements" (center), "Negated Statements" (right).
* **Axes:** All three plots share the same unlabeled axes with a numerical range from approximately -2.5 to +1.5 on the x-axis and -3 to +1 on the y-axis.
* **Legend (Left Plot Only):** Located in the bottom-left corner.
* Purple square: "False"
* Orange triangle: "True"
* **Data Points:**
* Purple squares represent "False" data points.
* Orange triangles represent "True" data points.
* In the center and right plots, a subset of points from the opposite category is grayed out for context.
* **Vectors (Green Arrows):**
* **Left Plot:** Two vectors originate near the origin (0,0). One points upward and slightly left, labeled **t_P**. The other points to the right, labeled **t_G**.
* **Center Plot:** One vector originates near the origin, pointing up and to the right, labeled **t_A**.
* **Right Plot:** No vectors are present.
**Bottom Row - Histograms:**
* **Left Histogram:**
* **Title/Annotation:** "AUROC: 0.98" in a box at the top-left.
* **X-axis Label:** `a^T t_G`
* **Y-axis Label:** "Frequency"
* **Data Series:** Two overlapping density curves. A purple curve (presumably for "False") and an orange curve (presumably for "True").
* **Rug Plot:** A strip of small vertical marks along the x-axis, colored purple and orange, showing individual data point locations.
* **Right Histogram:**
* **Title/Annotation:** "AUROC: 0.87" in a box at the top-left.
* **X-axis Label:** `a^T t_A`
* **Y-axis Label:** "Frequency"
* **Data Series:** Two overlapping density curves. A purple curve and an orange curve.
* **Rug Plot:** Similar to the left histogram, with purple and orange marks.
### Detailed Analysis
**Scatter Plots (Spatial & Trend Analysis):**
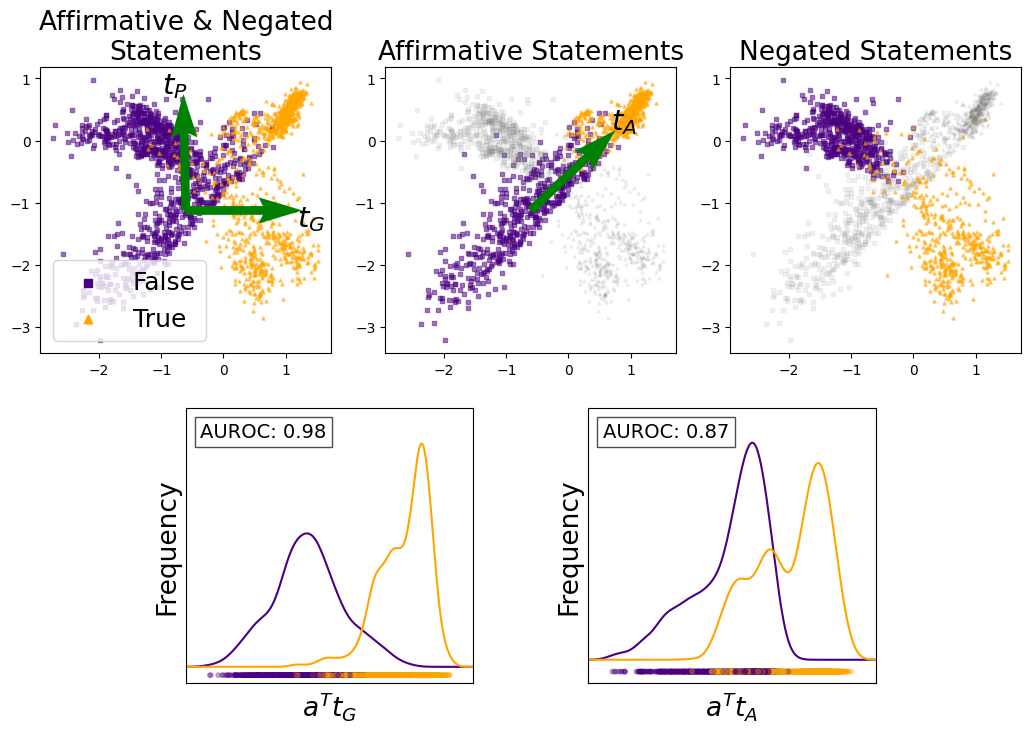
1. **Affirmative & Negated Statements (Left):** This plot combines all data. The "False" (purple) points form a dense cluster primarily in the left and upper-left quadrants. The "True" (orange) points form a dense cluster primarily in the right and lower-right quadrants. There is a clear separation between the two classes along a diagonal axis from top-left to bottom-right. The vector **t_G** points directly into the heart of the "True" cluster. The vector **t_P** points towards the upper region of the "False" cluster.
2. **Affirmative Statements (Center):** This plot shows only the "Affirmative" subset of data. The "True" (orange) points are now tightly clustered in the upper-right quadrant. The "False" (purple) points are clustered in the lower-left quadrant. The grayed-out points represent the "Negated" statements from the full dataset. The vector **t_A** points directly into the "True" cluster, showing a strong directional separation for this subset.
3. **Negated Statements (Right):** This plot shows only the "Negated" subset. The "True" (orange) points are now in the lower-right quadrant. The "False" (purple) points are in the upper-left quadrant. The separation is still present but appears less tight than in the "Affirmative" subset. The grayed-out points are the "Affirmative" statements.
**Histograms (Distribution Analysis):**
1. **Left Histogram (`a^T t_G`):** The distributions for "False" (purple) and "True" (orange) are highly separated. The "False" distribution peaks at a lower value (approx. -0.5 to 0), while the "True" distribution peaks at a higher value (approx. 0.5 to 1). The very high **AUROC of 0.98** confirms excellent separability between the classes when projected onto the `t_G` direction.
2. **Right Histogram (`a^T t_A`):** The distributions show more overlap. The "False" (purple) distribution has a primary peak at a lower value and a secondary shoulder. The "True" (orange) distribution has a primary peak at a higher value. The **AUROC of 0.87** indicates good, but not perfect, separability when projected onto the `t_A` direction.
### Key Observations
* **Class Separation:** There is a consistent spatial separation between "True" and "False" data points across all scatter plots, indicating the underlying features capture meaningful differences.
* **Vector Directionality:** The green vectors (**t_G**, **t_P**, **t_A**) appear to be discriminative directions learned or identified to separate the classes. **t_G** seems optimal for the full dataset, while **t_A** is optimal for the "Affirmative" subset.
* **Subset Behavior:** The spatial arrangement of "True" and "False" points shifts between the "Affirmative" and "Negated" subsets. "True" points move from upper-right (Affirmative) to lower-right (Negated), while "False" points move from lower-left (Affirmative) to upper-left (Negated).
* **Performance Metric:** The AUROC values (0.98 and 0.87) are quantitative measures of classification performance based on the projections, with the projection onto `t_G` yielding near-perfect separation.
### Interpretation
This figure demonstrates a method for analyzing and visualizing how a system distinguishes between true and false statements. The scatter plots likely represent data points (e.g., sentence embeddings) projected into a 2D space. The vectors **t_G**, **t_P**, and **t_A** are critical—they represent directions in this space that maximize the separation between truth values.
The key insight is that the optimal direction for separation (**t_G**) differs from the direction that might be specific to affirmative statements (**t_A**). The high AUROC for `a^T t_G` suggests that a single, well-chosen projection can almost perfectly classify all statements as true or false. The slightly lower AUROC for `a^T t_A` indicates that while the affirmative-specific direction is good, it is less generalizable than the global direction.
The shifting clusters between the "Affirmative" and "Negated" plots suggest that the linguistic structure (affirmation vs. negation) interacts with the truth value in the embedding space. A robust truth-detection system must account for this interaction, perhaps by learning directions like **t_G** that are invariant to such syntactic variations. The visualization effectively argues for the existence of a consistent, linearly separable "truth direction" within the model's representation space.
DECODING INTELLIGENCE...