## Scatter Plots and Histograms: Classification of Affirmative/Negated Statements
### Overview
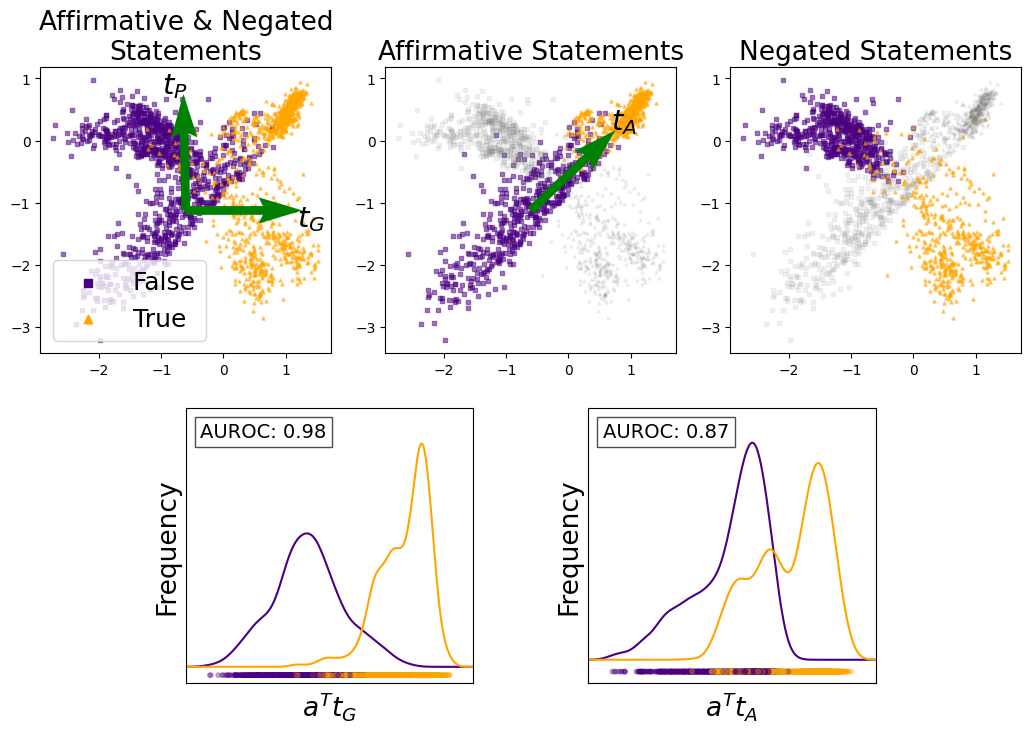
The image contains three scatter plots and two histograms analyzing the classification of affirmative and negated statements. The scatter plots visualize feature distributions for "True" (orange) and "False" (purple) statements, while the histograms show frequency distributions of transformed features with associated AUROC scores.
---
### Components/Axes
#### Scatter Plots
1. **Affirmative & Negated Statements**
- **Axes**:
- X-axis: `t_G` (horizontal, -3 to 1)
- Y-axis: `t_P` (vertical, -3 to 1)
- **Legend**:
- Purple squares: False
- Orange triangles: True
- **Annotations**:
- Green arrows labeled `t_P` (upward) and `t_G` (rightward) from origin.
2. **Affirmative Statements**
- **Axes**:
- X-axis: `t_G` (horizontal, -3 to 1)
- Y-axis: `t_A` (vertical, -3 to 1)
- **Legend**:
- Gray squares: False
- Orange triangles: True
- **Annotations**:
- Green arrow labeled `t_A` (up-right) from origin.
3. **Negated Statements**
- **Axes**:
- X-axis: `t_G` (horizontal, -3 to 1)
- Y-axis: `t_A` (vertical, -3 to 1)
- **Legend**:
- Purple squares: False
- Orange triangles: True
#### Histograms
1. **a^Tt_G**
- **X-axis**: `a^Tt_G` (continuous)
- **Y-axis**: Frequency (continuous)
- **Curves**:
- Purple: False
- Orange: True
- **AUROC**: 0.98 (top-right corner)
2. **a^Tt_A**
- **X-axis**: `a^Tt_A` (continuous)
- **Y-axis**: Frequency (continuous)
- **Curves**:
- Purple: False
- Orange: True
- **AUROC**: 0.87 (top-right corner)
---
### Detailed Analysis
#### Scatter Plots
1. **Affirmative & Negated Statements**
- **True (orange)**: Clustered in upper-right quadrant (positive `t_P` and `t_G`).
- **False (purple)**: Distributed across lower-left and upper-left quadrants.
- **Trend**: Positive correlation between `t_P` and `t_G` for True statements.
2. **Affirmative Statements**
- **True (orange)**: Concentrated in upper-right quadrant (high `t_A` and `t_G`).
- **False (gray)**: Spread across lower-left and upper-left quadrants.
- **Trend**: Strong positive relationship between `t_A` and `t_G` for True statements.
3. **Negated Statements**
- **True (orange)**: Clustered in upper-left quadrant (high `t_A`, low `t_G`).
- **False (purple)**: Distributed across lower-left and upper-right quadrants.
- **Trend**: True statements exhibit inverse relationship between `t_A` and `t_G`.
#### Histograms
1. **a^Tt_G**
- **False (purple)**: Bimodal distribution with peaks at ~-1.5 and 0.5.
- **True (orange)**: Single peak at ~0.8, higher frequency than False.
- **AUROC**: 0.98 (excellent separability).
2. **a^Tt_A**
- **False (purple)**: Bimodal distribution with peaks at ~-1.2 and 0.3.
- **True (orange)**: Single peak at ~0.6, moderate frequency separation.
- **AUROC**: 0.87 (good separability).
---
### Key Observations
1. **Feature Separability**:
- `a^Tt_G` shows superior classification performance (AUROC 0.98) compared to `a^Tt_A` (0.87).
- True statements for `a^Tt_G` are tightly clustered, while False statements are more dispersed.
2. **Dimensionality Reduction**:
- Transformed features (`a^Tt_G`, `a^Tt_A`) better separate True/False statements than raw features (`t_P`, `t_G`, `t_A`).
3. **Bimodal Distributions**:
- False statements exhibit bimodal distributions in both histograms, suggesting two distinct subgroups.
---
### Interpretation
The data demonstrates that transformed features (`a^Tt_G`, `a^Tt_A`) are more effective for distinguishing True/False statements than raw features. The high AUROC for `a^Tt_G` (0.98) indicates it is a robust classifier, while `a^Tt_A` (0.87) remains viable but less precise. The scatter plots reveal that True statements occupy distinct regions in feature space, with `a^Tt_G` showing the clearest separation. The bimodal distributions for False statements suggest potential subgroups requiring further investigation. These findings highlight the importance of feature engineering in improving classification accuracy.