## Diagram: Probability Calculation Steps
### Overview
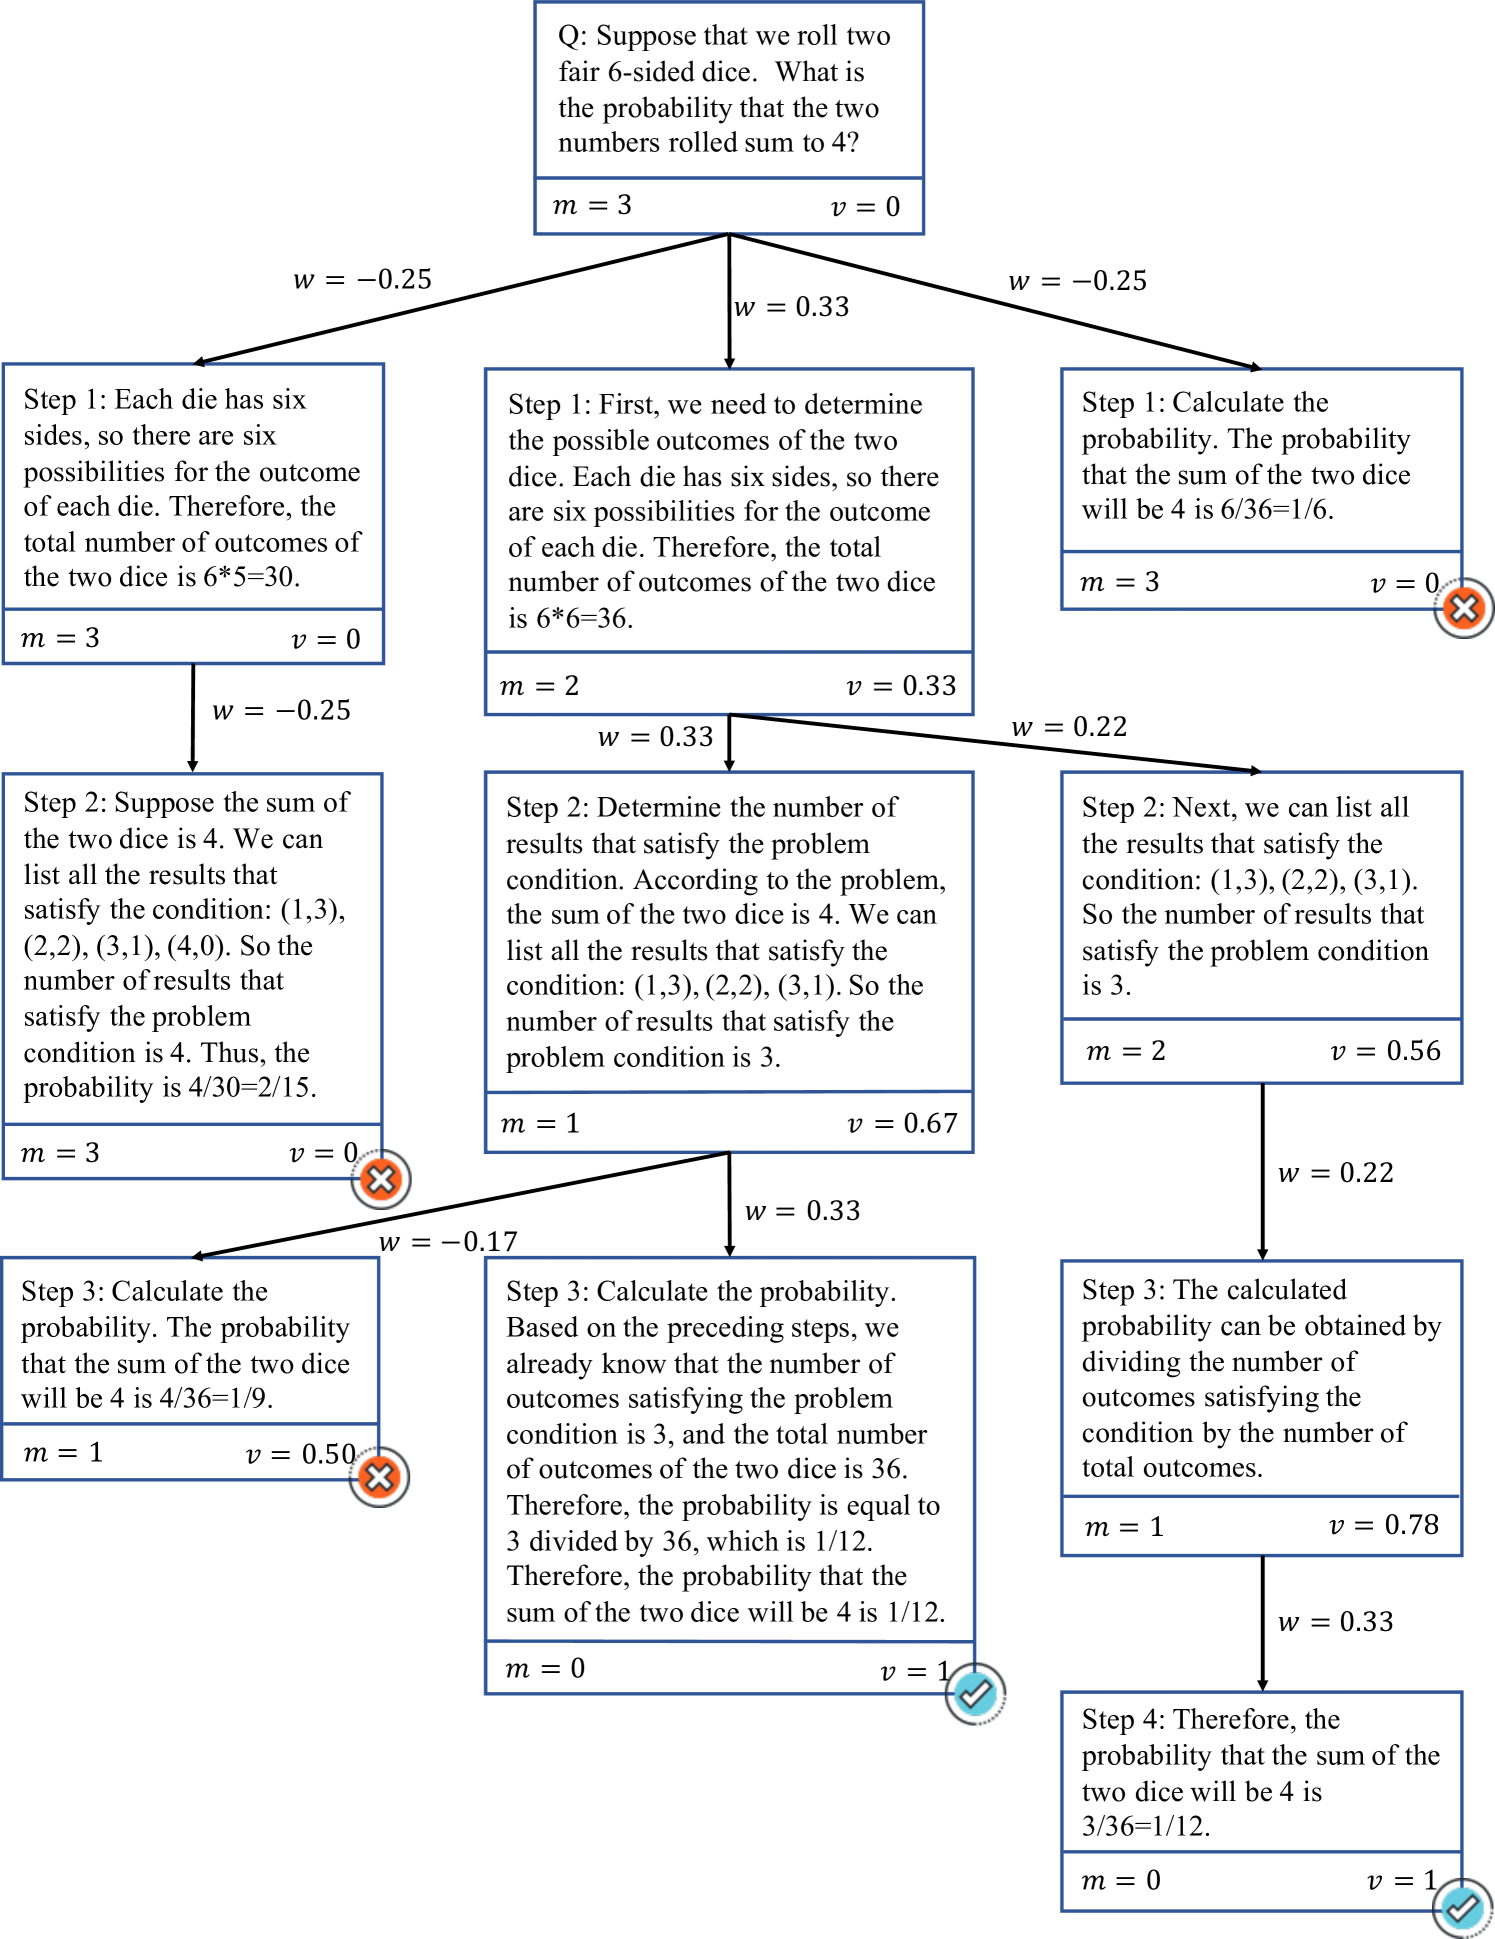
This diagram illustrates the steps to calculate the probability that the sum of two fair 6-sided dice equals 4. The diagram is structured as a flow chart, with each step presented in a rectangular box, and arrows indicating the progression of the calculation. Each step includes a visual representation of 'm', 'v', and 'w' values, along with a small 'x' mark in some boxes.
### Components/Axes
The diagram consists of nine rectangular boxes arranged in a 3x3 grid. Each box represents a step in the probability calculation. Within each box, there are three variables:
* **m**: Represented by a horizontal bar, with values ranging from 1 to 3.
* **v**: Represented by a vertical bar, with values ranging from 0 to 0.67.
* **w**: Represented by a curved line, with values ranging from -0.25 to 0.33.
Each box also contains a textual description of the step. A question is posed at the top of the diagram: "Suppose that we roll two fair 6-sided dice. What is the probability that the two numbers rolled sum to 4?".
### Detailed Analysis or Content Details
**Step 1 (Top-Left):**
* Text: "Each die has six sides, so there are six possibilities for the outcome of each die. Therefore, the total number of outcomes of the two dice is 6\*6=30."
* m = 3
* v = 0
* w = -0.25
**Step 2 (Top-Center):**
* Text: "First, we need to determine the possible outcomes of the two dice. Each die has six sides, so there are six possibilities for the outcome of each die. Therefore, the total number of outcomes of the two dice is 6\*6=36."
* m = 2
* v = 0.33
* w = 0.33
**Step 3 (Top-Right):**
* Text: "Calculate the probability that the sum of the two dice will be 4 is 6/36=1/6."
* m = 3
* v = 0
* w = -0.25
* A red 'X' is drawn over the 'v' bar.
**Step 4 (Middle-Left):**
* Text: "Suppose the sum of the two dice is 4. We can list all the results that satisfy the condition: (1,3), (2,2), (3,1), (4,0). So the number of results that satisfy the problem condition is 4. Thus, the probability is 4/30=2/15."
* m = 3
* v = 0
* w = -0.17
* A red 'X' is drawn over the 'v' bar.
**Step 5 (Middle-Center):**
* Text: "Determine the number of results that satisfy the problem condition. According to the problem, the sum of the two dice is 4. We can list all the results that satisfy the condition: (1,3), (2,2), (3,1). So the number of results that satisfy the problem condition is 3."
* m = 1
* v = 0.67
* w = 0.33
**Step 6 (Middle-Right):**
* Text: "Next, we can list all the results that satisfy the condition: (1,3), (2,2), (3,1). So the number of results that satisfy the problem condition is 3."
* m = 2
* v = 0.56
* w = 0.22
**Step 7 (Bottom-Left):**
* Text: "Calculate the probability. The probability that the sum of the two dice will be 4 is 4/36=1/9."
* m = 1
* v = 0
* w = -0.17
* A red 'X' is drawn over the 'v' bar.
**Step 8 (Bottom-Center):**
* Text: "Calculate the probability. Based on the preceding steps, we already know that the number of outcomes satisfying the problem condition is 3, and the total number of outcomes is 36. Therefore, the probability is equal to 3 divided by 36, which is 1/12. Therefore, the probability that the sum of the two dice will be 4 is 1/12."
* m = 3
* v = 0.33
* w = 0.33
**Step 9 (Bottom-Right):**
* Text: "The calculated probability can be obtained by dividing the number of outcomes satisfying the condition by the total number of outcomes."
* m = 2
* v = 0.47
* w = 0.22
* Text: "Probability that the sum is 4 is 3/36=1/12."
* Text: "Therefore, the probability that the sum will be 4 is 1/12."
### Key Observations
The diagram presents a step-by-step solution to a probability problem. There are inconsistencies in the initial calculations. Step 1 states the total number of outcomes as 30, while Step 2 correctly states it as 36. The 'X' marks over the 'v' bars in Steps 3 and 7 suggest an error or correction in those steps. The final answer, consistently stated in Steps 8 and 9, is 1/12.
### Interpretation
The diagram demonstrates a common approach to solving probability problems: identifying the total possible outcomes, identifying the favorable outcomes, and then calculating the probability as the ratio of favorable to total outcomes. The initial error in calculating the total number of outcomes (6\*6=30 instead of 36) highlights the importance of careful calculation. The 'X' marks suggest a process of revision and correction. The diagram ultimately arrives at the correct probability of 1/12 for the sum of two dice equaling 4. The 'm', 'v', and 'w' variables appear to be arbitrary visual elements and do not contribute to the mathematical understanding of the problem. They may be intended to represent some underlying process or state, but their meaning is not explicitly defined within the diagram. The diagram is a pedagogical tool, illustrating the thought process involved in solving a probability problem, rather than a rigorous mathematical proof.