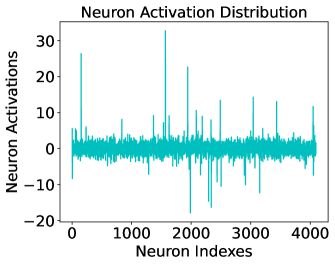
## Line Chart: Neuron Activation Distribution
### Overview
This image is a line chart titled "Neuron Activation Distribution." It visualizes the activation levels of a series of neurons, likely within a hidden layer of a neural network. The data is plotted as a single, dense cyan line against a sequence of indices.
### Components/Axes
* **Title**: "Neuron Activation Distribution" (Top-center)
* **Y-Axis Label**: "Neuron Activations" (Left-center, vertical orientation)
* **Y-Axis Scale**: Numerical range from -20 to 30. Major tick marks are placed at intervals of 10: **-20, -10, 0, 10, 20, 30**.
* **X-Axis Label**: "Neuron Indexes" (Bottom-center)
* **X-Axis Scale**: Numerical range from 0 to approximately 4100. Major tick marks are placed at intervals of 1000: **0, 1000, 2000, 3000, 4000**.
* **Data Series**: A single continuous line in a cyan/teal color.
### Detailed Analysis
The chart displays a high-frequency signal where the majority of values are clustered near the zero-axis, punctuated by several high-magnitude spikes.
* **Visual Trend**: The line maintains a relatively stable "baseline" of low-amplitude noise across the entire X-axis, with no overall upward or downward slope. However, it is characterized by extreme vertical volatility at specific indices.
* **Baseline Range**: Most activations fluctuate within a narrow band of approximately **-4 to +4**.
* **Significant Positive Spikes (Approximate values)**:
* **Index ~200**: ~26
* **Index ~1600**: ~33 (The global maximum)
* **Index ~2000**: ~23
* **Index ~2400**: ~14
* **Index ~3100**: ~15
* **Index ~3500**: ~13
* **Index ~4050**: ~12
* **Significant Negative Spikes (Approximate values)**:
* **Index ~2000**: ~-18 (The global minimum)
* **Index ~2300**: ~-15
* **Index ~2400**: ~-16
* **Index ~3200**: ~-12
### Key Observations
* **Sparsity**: The vast majority of neurons (indices) have low activation values, suggesting a sparse representation where only a few "features" are highly active for a given input.
* **Outlier Dimensions**: There are distinct "outlier" neurons that exhibit activations significantly higher (over 10x) than the average neuron.
* **Symmetry**: While there are more extreme positive spikes than negative ones, the distribution shows significant activity in both directions relative to zero.
### Interpretation
* **Neural Network Architecture**: The X-axis ending just past 4000 strongly suggests a layer size of **4096** (2^12), which is a standard dimension for hidden layers in many Transformer-based models (like GPT or Llama).
* **Feature Detection**: The high-magnitude spikes represent specific neurons that have "fired" strongly. In a technical context, this suggests these specific indices (e.g., index 1600) are highly sensitive to the current input data, acting as specialized feature detectors.
* **Activation Function Implications**: The presence of negative values indicates that the data shown is either "pre-activation" (before a function like ReLU is applied) or that the model utilizes an activation function that permits negative values, such as **GeLU (Gaussian Error Linear Unit)** or **SiLU (Sigmoid Linear Unit)**, which are common in modern LLMs.
* **Quantization Challenges**: The extreme outliers (reaching 33 while the bulk is near 0) illustrate why 8-bit or 4-bit quantization of neural networks is difficult; the high dynamic range requires careful scaling to avoid losing the information contained in these high-magnitude "outlier dimensions."