\n
## Line Chart: Neuron Activation Distribution
### Overview
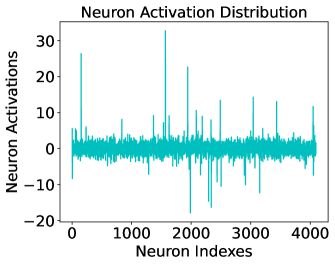
The image presents a line chart visualizing the distribution of neuron activations across neuron indices. The chart displays a fluctuating pattern of activation values, ranging from approximately -20 to 30, across a range of neuron indices from 0 to 4000.
### Components/Axes
* **Title:** "Neuron Activation Distribution" - positioned at the top-center of the chart.
* **X-axis:** "Neuron Indexes" - ranging from 0 to 4000, with tick marks at 1000, 2000, 3000, and 4000.
* **Y-axis:** "Neuron Activations" - ranging from -20 to 30, with tick marks at -20, 0, 10, 20, and 30.
* **Data Series:** A single teal-colored line representing the neuron activation values.
### Detailed Analysis
The line chart shows a highly variable pattern of neuron activations.
* **Initial Spike:** There's a significant positive spike in activation around Neuron Index 0, reaching approximately 28.
* **Fluctuations:** From Neuron Index 0 to approximately 4000, the activation values fluctuate considerably, crossing the zero activation level multiple times.
* **Negative Activations:** There are several instances of negative activations, with the lowest value reaching approximately -18 around Neuron Index 2500.
* **General Trend:** The overall trend appears relatively stable around the zero activation level, with frequent and substantial deviations both above and below.
* **Specific Data Points (approximate):**
* Neuron Index 0: Activation ≈ 28
* Neuron Index 500: Activation ≈ 5
* Neuron Index 1000: Activation ≈ -2
* Neuron Index 1500: Activation ≈ 12
* Neuron Index 2000: Activation ≈ 20
* Neuron Index 2500: Activation ≈ -18
* Neuron Index 3000: Activation ≈ 8
* Neuron Index 3500: Activation ≈ -5
* Neuron Index 4000: Activation ≈ 10
### Key Observations
* The distribution of neuron activations is not uniform.
* There are periods of high activation, followed by periods of low or negative activation.
* The fluctuations suggest a dynamic and complex neural network activity.
* The initial spike at Neuron Index 0 is a notable outlier.
### Interpretation
The chart suggests that the neuron activations are highly variable and not consistently positive. This could indicate that the network is processing complex information, or that it is in a state of learning or adaptation. The presence of negative activations suggests inhibitory signals or a specific type of neural coding. The initial spike might represent a strong initial response to a stimulus or a specific feature. The overall pattern suggests a non-linear relationship between neuron index and activation level, indicating that different neurons respond differently to the input. The data suggests a complex system with both excitatory and inhibitory processes at play. The fluctuations could be due to noise, or they could represent meaningful variations in the network's activity. Further analysis would be needed to determine the underlying causes of these patterns.