## Line Chart: Neuron Activation Distribution
### Overview
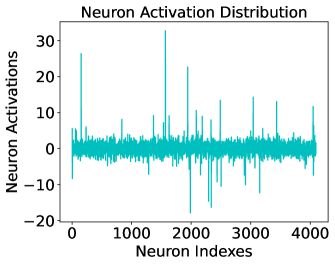
The image depicts a line chart titled "Neuron Activation Distribution," visualizing neuron activation levels across a range of neuron indexes. The y-axis represents neuron activation values (ranging from -20 to 30), while the x-axis represents neuron indexes (0 to 4000). The chart shows a cyan-colored line with significant fluctuations, indicating variability in neuron activation across the dataset.
### Components/Axes
- **Title**: "Neuron Activation Distribution" (centered at the top).
- **Y-Axis**: Labeled "Neuron Activations," with tick marks at intervals of 10 (-20, -10, 0, 10, 20, 30).
- **X-Axis**: Labeled "Neuron Indexes," with tick marks at intervals of 1000 (0, 1000, 2000, 3000, 4000).
- **Legend**: Positioned at the top-right, labeled "Neuron Activations" with a cyan color swatch.
- **Data Line**: A single cyan line traversing the chart, with no additional data series.
### Detailed Analysis
- **Y-Axis Values**: The neuron activation values oscillate between approximately -20 and +30, with no clear baseline (mean or median) explicitly marked.
- **X-Axis Values**: Neuron indexes span from 0 to 4000, with no gaps or missing data points.
- **Line Behavior**: The cyan line exhibits irregular spikes and troughs. Notable peaks occur near neuron indexes 500 (activation ~25), 1500 (activation ~20), and 3500 (activation ~15). Troughs are observed near indexes 1000 (activation ~-15) and 3000 (activation ~-10). The majority of the line hovers near 0, with smaller fluctuations (±5) in between larger deviations.
### Key Observations
1. **High Variability**: Neuron activations show significant variability, with some neurons exhibiting extreme positive or negative activations.
2. **Outliers**: Peaks at indexes 500, 1500, and 3500 stand out as local maxima, while troughs at 1000 and 3000 are notable minima.
3. **Baseline Proximity**: Most neuron activations cluster near 0, suggesting a baseline activation level with intermittent deviations.
### Interpretation
The chart suggests a heterogeneous distribution of neuron activation, where individual neurons exhibit diverse responses. The large spikes and troughs may indicate neurons with specialized or heightened sensitivity to specific stimuli, while the baseline clustering implies a majority of neurons maintain moderate activation levels. The lack of a consistent trend (e.g., gradual increase/decrease) implies no overarching pattern in the dataset, potentially reflecting biological noise or contextual variability in neural activity. The absence of a labeled dataset or experimental conditions limits conclusions about causality or functional significance.