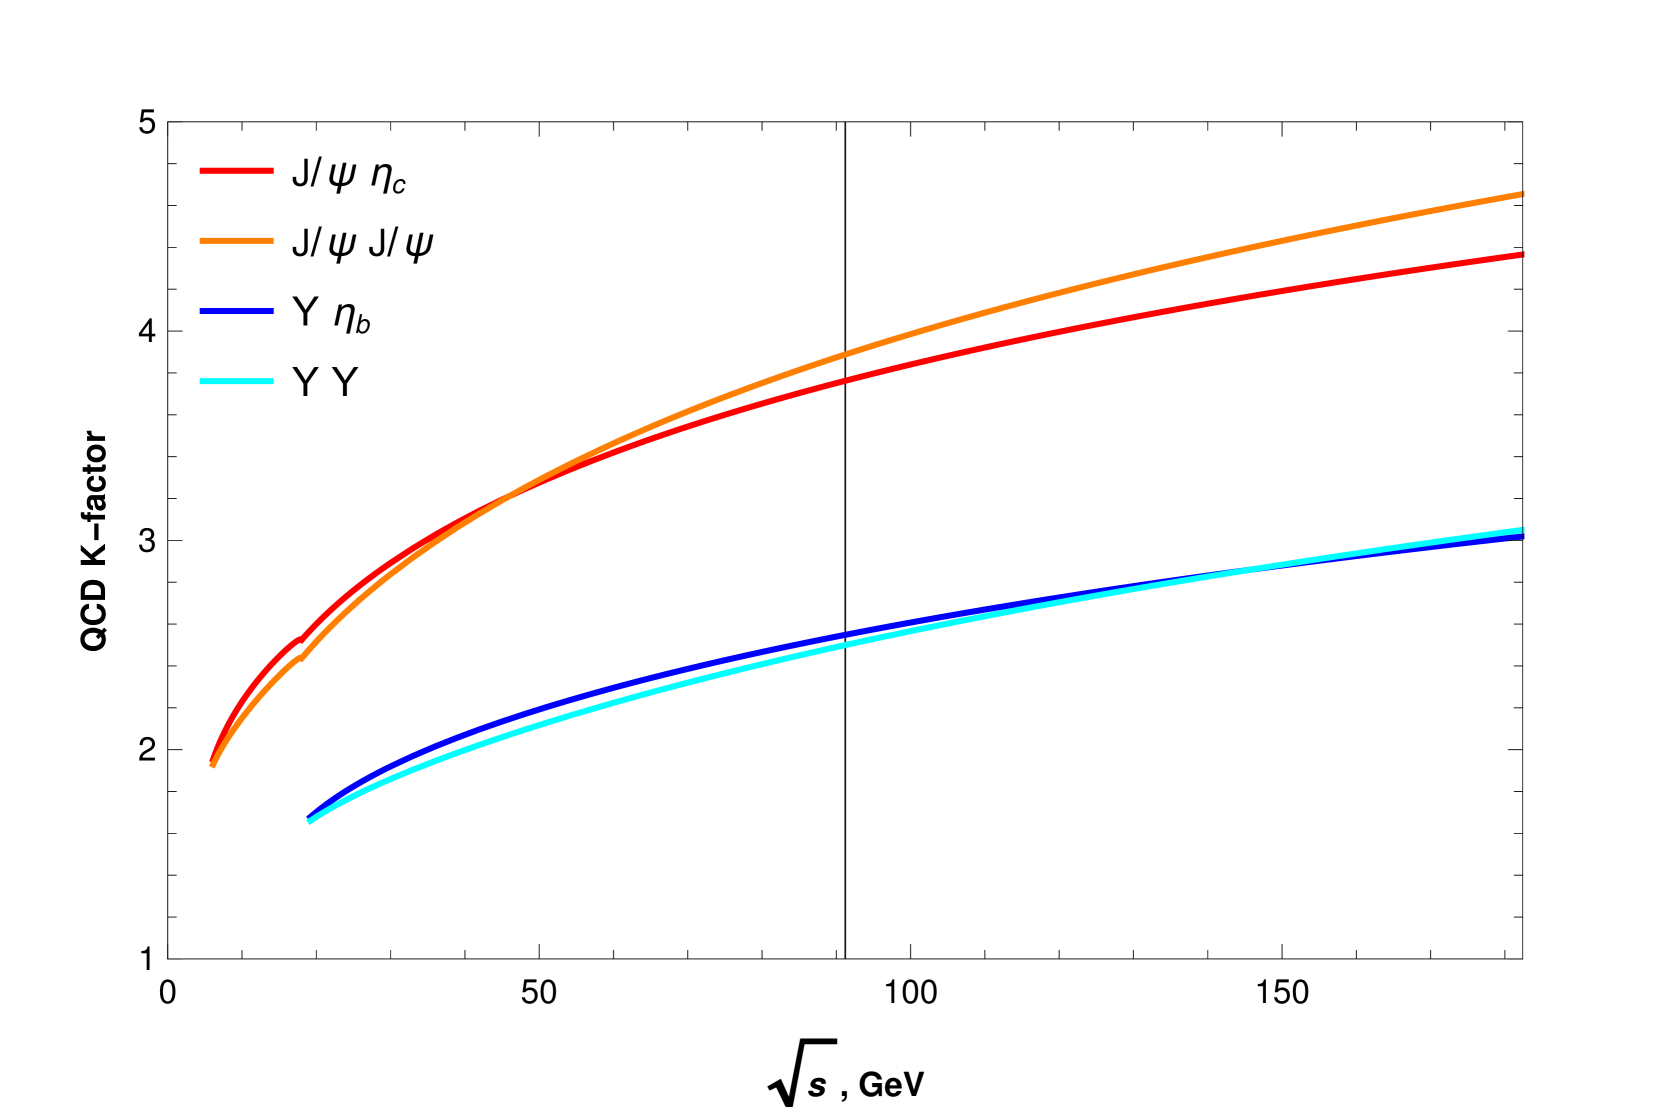
## Line Chart: QCD K-factor vs. √s
### Overview
The image is a line chart comparing the QCD K-factor for different particle combinations as a function of √s (center-of-mass energy) in GeV. Four different particle combinations are plotted: J/ψ ηc, J/ψ J/ψ, Υ ηb, and Υ Υ. The chart shows how the QCD K-factor changes with increasing energy for each combination.
### Components/Axes
* **X-axis:** √s, GeV (square root of s, measured in GeV). The axis ranges from 0 to 150 GeV, with tick marks at intervals of 50 GeV.
* **Y-axis:** QCD K-factor. The axis ranges from 0 to 5, with tick marks at integer intervals.
* **Legend:** Located in the top-left corner, the legend identifies the four data series:
* Red: J/ψ ηc
* Orange: J/ψ J/ψ
* Blue: Υ ηb
* Cyan: Υ Υ
* A vertical line is present at approximately x = 95 GeV.
### Detailed Analysis
* **J/ψ ηc (Red):** The line starts at approximately (0, 1.9) and increases to approximately (150, 4.4). The slope decreases as x increases.
* **J/ψ J/ψ (Orange):** The line starts at approximately (0, 2.0) and increases to approximately (150, 4.6). The slope decreases as x increases.
* **Υ ηb (Blue):** The line starts at approximately (0, 1.6) and increases to approximately (150, 3.0). The slope decreases as x increases.
* **Υ Υ (Cyan):** The line starts at approximately (0, 1.7) and increases to approximately (150, 3.0). The slope decreases as x increases.
### Key Observations
* The J/ψ ηc and J/ψ J/ψ combinations have higher QCD K-factors than the Υ ηb and Υ Υ combinations across the entire range of √s.
* The J/ψ J/ψ combination has the highest QCD K-factor at √s = 150 GeV.
* The Υ ηb and Υ Υ combinations have very similar QCD K-factors across the entire range of √s.
* All four lines show a positive correlation between √s and the QCD K-factor, but the rate of increase diminishes as √s increases.
### Interpretation
The chart illustrates how the QCD K-factor, a measure of the radiative corrections in quantum chromodynamics (QCD), varies with the center-of-mass energy (√s) for different quarkonium states. The higher K-factors for the J/ψ ηc and J/ψ J/ψ combinations compared to the Υ ηb and Υ Υ combinations suggest that the radiative corrections are more significant for the charmonium states (containing charm quarks) than for the bottomonium states (containing bottom quarks) within the energy range considered. The convergence of the lines at higher energies might indicate a saturation effect, where the radiative corrections become less sensitive to the energy scale. The vertical line at approximately 95 GeV does not have an explicit label, but it may represent a specific energy threshold or a point of interest for comparison.