## Line Chart: QCD K-factor vs. Energy (√s, GeV)
### Overview
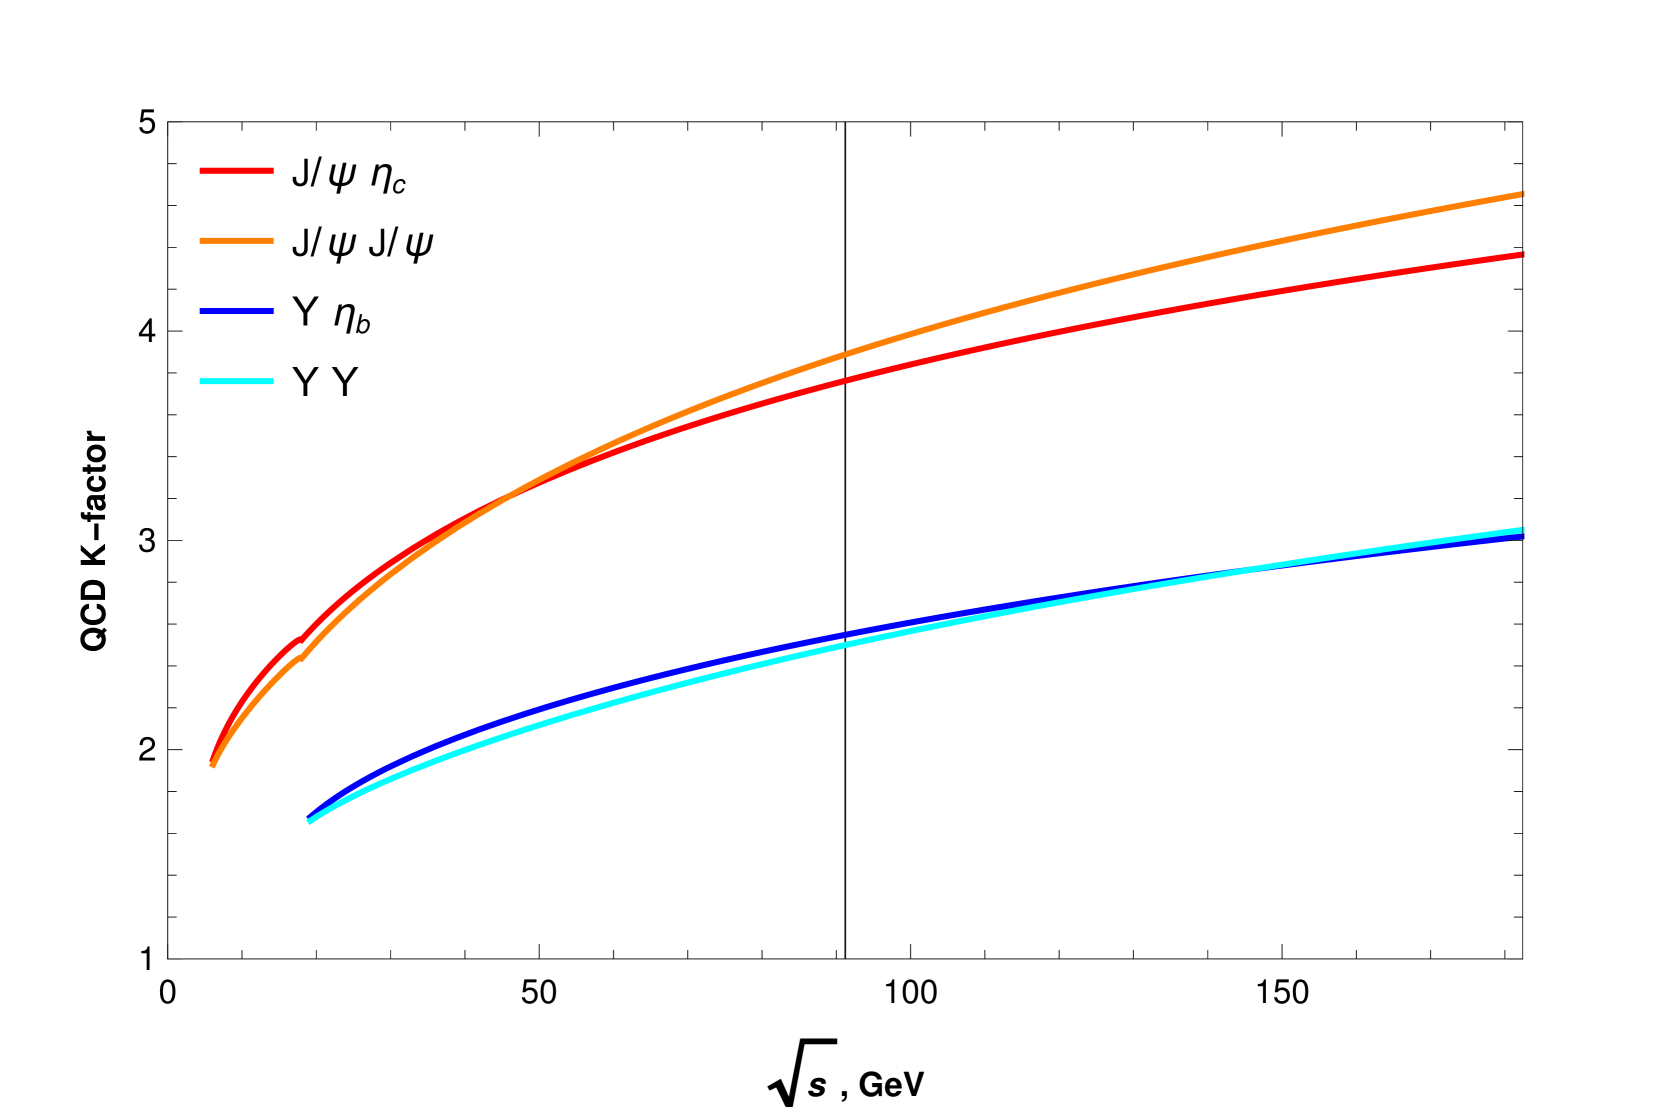
The image is a line chart depicting the relationship between the QCD K-factor and the collision energy (√s, in GeV). Four distinct data series are plotted, each representing different particle interactions. A vertical dashed line at √s = 100 GeV serves as a reference point. The chart emphasizes trends in K-factor values across energy scales, with clear divergences between series.
### Components/Axes
- **X-axis**: √s (Collision energy), labeled in GeV, ranging from 0 to 180 GeV.
- **Y-axis**: QCD K-factor, ranging from 1 to 5.
- **Legend**: Located on the right, with four entries:
- Red: J/ψ η_c
- Orange: J/ψ J/ψ
- Blue: Υ η_b
- Cyan: Υ Υ
- **Vertical Line**: Dashed black line at √s = 100 GeV.
### Detailed Analysis
1. **J/ψ η_c (Red Line)**:
- Starts at ~2.0 at √s = 0 GeV.
- Increases steadily, reaching ~4.5 at √s = 180 GeV.
- Crosses the 100 GeV vertical line at ~3.8.
2. **J/ψ J/ψ (Orange Line)**:
- Begins slightly below the red line at √s = 0 GeV (~1.9).
- Diverges upward, surpassing the red line after ~50 GeV.
- Reaches ~4.7 at √s = 180 GeV.
- Crosses the 100 GeV line at ~4.0.
3. **Υ η_b (Blue Line)**:
- Starts at ~1.6 at √s = 0 GeV.
- Rises gradually, reaching ~3.0 at √s = 180 GeV.
- Crosses the 100 GeV line at ~2.6.
4. **Υ Υ (Cyan Line)**:
- Begins at ~1.5 at √s = 0 GeV.
- Increases steadily, surpassing the blue line after ~50 GeV.
- Reaches ~3.1 at √s = 180 GeV.
- Crosses the 100 GeV line at ~2.7.
### Key Observations
- The **J/ψ J/ψ (orange)** and **J/ψ η_c (red)** lines dominate at higher energies, with the orange line consistently above the red.
- The **Υ Υ (cyan)** and **Υ η_b (blue)** lines show lower K-factors but converge near √s = 100 GeV.
- The vertical line at 100 GeV acts as a threshold, with all series showing accelerated growth beyond this point.
### Interpretation
The chart illustrates how QCD K-factors scale with collision energy for different particle interactions. The divergence between the J/ψ and Υ series suggests distinct QCD dynamics: J/ψ processes exhibit stronger scaling, while Υ processes show milder growth. The 100 GeV threshold may correspond to a phase transition or critical energy where QCD effects intensify. The orange line’s dominance at high energies implies that J/ψ J/ψ interactions are more sensitive to QCD corrections than other processes. This could reflect differences in gluon density or interaction mechanisms between charm (J/ψ) and bottom (Υ) quark systems.