## Chart/Diagram Type: Comparative Box Plots and Density Plots
### Overview
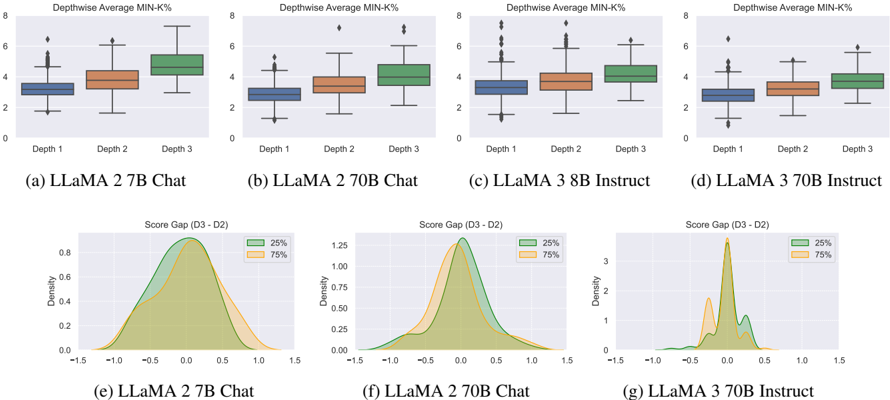
The image presents a comparative analysis of different LLaMA models using box plots and density plots. The top row displays box plots showing the "Depthwise Average MIN-K%" for different depths (Depth 1, Depth 2, Depth 3). The bottom row shows density plots of the "Score Gap (D3 - D2)" for 25% and 75% quantiles. The models compared are LLaMA 2 7B Chat, LLaMA 2 70B Chat, LLaMA 3 8B Instruct, and LLaMA 3 70B Instruct.
### Components/Axes
**Top Row (Box Plots):**
* **Title:** Depthwise Average MIN-K%
* **Y-axis:** Values ranging from 0 to 8.
* **X-axis:** Categorical, representing "Depth 1", "Depth 2", and "Depth 3".
* **Models (Subplots):**
* (a) LLaMA 2 7B Chat
* (b) LLaMA 2 70B Chat
* (c) LLaMA 3 8B Instruct
* (d) LLaMA 3 70B Instruct
**Bottom Row (Density Plots):**
* **Title:** Score Gap (D3 - D2)
* **Y-axis:** Density, ranging from 0 to approximately 0.8 (e), 1.25 (f), and 3 (g).
* **X-axis:** Score Gap, ranging from -1.5 to 1.5.
* **Legend (Top-Right):**
* Green: 25%
* Orange: 75%
* **Models (Subplots):**
* (e) LLaMA 2 7B Chat
* (f) LLaMA 2 70B Chat
* (g) LLaMA 3 70B Instruct
### Detailed Analysis
**Box Plots (Depthwise Average MIN-K%):**
* **LLaMA 2 7B Chat (a):**
* Depth 1: Median around 3.5, IQR (Interquartile Range) from approximately 2.5 to 4.5.
* Depth 2: Median around 3.5, IQR from approximately 3 to 4.
* Depth 3: Median around 4, IQR from approximately 3 to 5.
* Trend: Slight increase in median MIN-K% from Depth 1 to Depth 3.
* **LLaMA 2 70B Chat (b):**
* Depth 1: Median around 3, IQR from approximately 2 to 4.
* Depth 2: Median around 3.5, IQR from approximately 2.5 to 4.
* Depth 3: Median around 4.5, IQR from approximately 3.5 to 5.
* Trend: Increase in median MIN-K% from Depth 1 to Depth 3.
* **LLaMA 3 8B Instruct (c):**
* Depth 1: Median around 3.5, IQR from approximately 2.5 to 4.
* Depth 2: Median around 4, IQR from approximately 3 to 5.
* Depth 3: Median around 4.5, IQR from approximately 3.5 to 5.5.
* Trend: Increase in median MIN-K% from Depth 1 to Depth 3.
* **LLaMA 3 70B Instruct (d):**
* Depth 1: Median around 3, IQR from approximately 2 to 4.
* Depth 2: Median around 3.5, IQR from approximately 2.5 to 4.
* Depth 3: Median around 4, IQR from approximately 3 to 5.
* Trend: Increase in median MIN-K% from Depth 1 to Depth 3.
**Density Plots (Score Gap D3 - D2):**
* **LLaMA 2 7B Chat (e):**
* 25% (Green): Peak density around -0.25.
* 75% (Orange): Peak density around 0.25.
* The 25% quantile distribution is shifted to the left compared to the 75% quantile.
* **LLaMA 2 70B Chat (f):**
* 25% (Green): Peak density around -0.25.
* 75% (Orange): Peak density around 0.
* The 25% quantile distribution is shifted to the left compared to the 75% quantile.
* **LLaMA 3 70B Instruct (g):**
* 25% (Green): Peak density around 0.
* 75% (Orange): Peak density around 0.
* Both quantiles are highly concentrated around 0, with a long tail to the left for the 25% quantile.
### Key Observations
* The box plots show a general trend of increasing "Depthwise Average MIN-K%" as the depth increases from Depth 1 to Depth 3 across all models.
* The density plots reveal differences in the distribution of the "Score Gap (D3 - D2)" between the 25% and 75% quantiles for different models.
* LLaMA 3 70B Instruct exhibits a significantly different "Score Gap" distribution compared to the other models, with both quantiles concentrated around 0.
### Interpretation
The data suggests that increasing the depth in these LLaMA models generally leads to a higher "Depthwise Average MIN-K%". The "Score Gap (D3 - D2)" density plots indicate how the performance changes between Depth 2 and Depth 3 at different quantiles. The concentrated distribution around 0 for LLaMA 3 70B Instruct suggests that the performance difference between Depth 3 and Depth 2 is minimal for both the 25th and 75th percentiles, implying a more consistent performance gain or lack thereof between these depths compared to the other models. The shift in the density plots between the 25% and 75% quantiles for LLaMA 2 7B Chat and LLaMA 2 70B Chat suggests that the performance gain from Depth 2 to Depth 3 is more pronounced for the 75th percentile compared to the 25th percentile.