TECHNICAL ASSET FINGERPRINT
15f2b65bc13b36c262cfe2a9
Click to view fullscreen
Press ESC or click to close
FOUND IN PAPERS
EXPERT: healer-alpha-free VERSION 1
RUNTIME: free/openrouter/healer-alpha
INTEL_VERIFIED
\n
## Box Plots and Density Plots: Depthwise Performance Analysis of LLaMA Models
### Overview
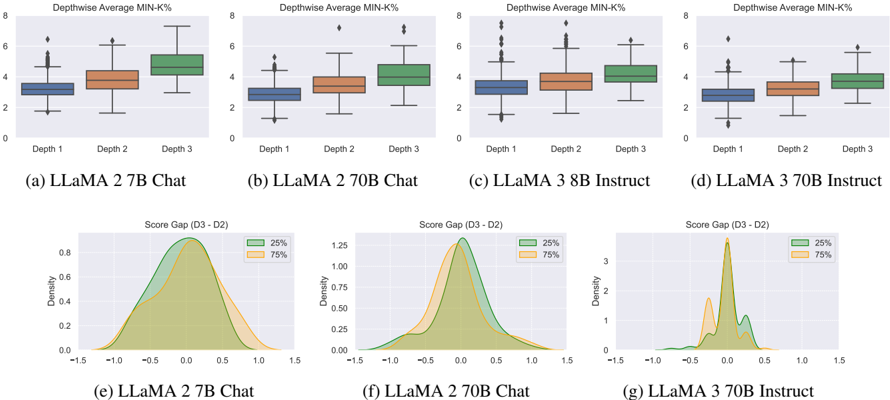
The image contains seven charts arranged in two rows. The top row (a-d) consists of four box plots comparing the "Depthwise Average MIN-K%" across three depths (Depth 1, Depth 2, Depth 3) for four different LLaMA model variants. The bottom row (e-g) consists of three density plots showing the distribution of the "Score Gap (D3 - D2)" for three of the models. The charts analyze the internal performance or activation metrics of these large language models across their layers.
### Components/Axes
**Top Row (Box Plots):**
* **Chart Titles:** (a) LLaMA 2 7B Chat, (b) LLaMA 2 70B Chat, (c) LLaMA 3 8B Instruct, (d) LLaMA 3 70B Instruct.
* **Y-Axis:** Labeled "Depthwise Average MIN-K%". The scale runs from 0 to 8 with major ticks at 0, 2, 4, 6, 8.
* **X-Axis:** Categories labeled "Depth 1", "Depth 2", "Depth 3".
* **Legend/Color Mapping:** While not explicitly labeled in a legend box, the color scheme is consistent across all four plots:
* **Depth 1:** Blue box plot.
* **Depth 2:** Orange box plot.
* **Depth 3:** Green box plot.
* **Spatial Grounding:** Each subplot is arranged horizontally. The box plots for each depth are placed side-by-side within their respective subplot.
**Bottom Row (Density Plots):**
* **Chart Titles:** (e) LLaMA 2 7B Chat, (f) LLaMA 2 70B Chat, (g) LLaMA 3 70B Instruct.
* **Y-Axis:** Labeled "Density". The scale varies per plot: (e) 0.0 to 0.8, (f) 0.0 to 1.25, (g) 0 to 3.
* **X-Axis:** Labeled "Score Gap (D3 - D2)". The scale runs from -1.5 to 1.5 with major ticks at -1.5, -1.0, -0.5, 0.0, 0.5, 1.0, 1.5.
* **Legend:** Located in the top-right corner of each density plot.
* **25%:** Green shaded area.
* **75%:** Orange shaded area.
* **Spatial Grounding:** The three density plots are arranged horizontally below the box plots. The legend is consistently placed in the upper right quadrant of each plot area.
### Detailed Analysis
**Box Plots (a-d): Depthwise Average MIN-K%**
* **Trend Verification:** In all four models, the median "Depthwise Average MIN-K%" shows a clear upward trend from Depth 1 to Depth 3. The spread (interquartile range) also generally increases with depth.
* **(a) LLaMA 2 7B Chat:**
* Depth 1 (Blue): Median ≈ 3.0. Range ≈ 1.5 to 5.5.
* Depth 2 (Orange): Median ≈ 3.5. Range ≈ 1.5 to 6.0.
* Depth 3 (Green): Median ≈ 4.5. Range ≈ 2.0 to 7.0.
* **(b) LLaMA 2 70B Chat:**
* Depth 1 (Blue): Median ≈ 2.5. Range ≈ 1.0 to 5.0.
* Depth 2 (Orange): Median ≈ 3.5. Range ≈ 1.5 to 6.0.
* Depth 3 (Green): Median ≈ 4.0. Range ≈ 2.0 to 6.5.
* **(c) LLaMA 3 8B Instruct:**
* Depth 1 (Blue): Median ≈ 3.0. Range ≈ 1.5 to 5.5.
* Depth 2 (Orange): Median ≈ 3.5. Range ≈ 2.0 to 6.0.
* Depth 3 (Green): Median ≈ 4.0. Range ≈ 2.5 to 6.5.
* **(d) LLaMA 3 70B Instruct:**
* Depth 1 (Blue): Median ≈ 2.5. Range ≈ 1.0 to 5.0.
* Depth 2 (Orange): Median ≈ 3.0. Range ≈ 1.5 to 5.5.
* Depth 3 (Green): Median ≈ 3.5. Range ≈ 2.0 to 6.0.
**Density Plots (e-g): Score Gap (D3 - D2)**
* **Trend Verification:** The plots show the distribution of the difference in scores between Depth 3 and Depth 2. A positive value indicates Depth 3 scored higher.
* **(e) LLaMA 2 7B Chat:**
* The distribution is broad and roughly symmetric, centered slightly above 0.0 (peak ≈ 0.1).
* The 25th percentile (green) and 75th percentile (orange) distributions overlap significantly, with the 75th percentile curve shifted slightly to the right (higher positive gap).
* **(f) LLaMA 2 70B Chat:**
* The distribution is sharper and more peaked than in (e), centered near 0.0.
* The 75th percentile (orange) curve has a higher peak and is slightly right-shifted compared to the 25th percentile (green) curve.
* **(g) LLaMA 3 70B Instruct:**
* The distribution is the sharpest and most peaked, centered very close to 0.0.
* It shows a distinct secondary peak or shoulder on the negative side (around -0.5) for the 75th percentile (orange) curve, suggesting a subset of cases where Depth 2 significantly outperforms Depth 3.
### Key Observations
1. **Consistent Depth Hierarchy:** Across all four models, the "Depthwise Average MIN-K%" metric increases monotonically from early (Depth 1) to later (Depth 3) layers.
2. **Model Size Effect:** The larger models (70B) in (b) and (d) show slightly lower median values at each corresponding depth compared to their smaller counterparts (7B/8B) in (a) and (c).
3. **Generational Difference:** LLaMA 3 models (c, d, g) exhibit tighter distributions (smaller interquartile ranges in box plots, sharper peaks in density plots) compared to LLaMA 2 models (a, b, e, f), suggesting more consistent behavior across layers.
4. **Score Gap Concentration:** The "Score Gap (D3 - D2)" is generally concentrated around zero, especially for the larger and newer models, indicating that the performance difference between adjacent deep layers is often small.
5. **Notable Anomaly:** The density plot for LLaMA 3 70B Instruct (g) shows a non-trivial probability mass for negative score gaps, particularly in the 75th percentile distribution, which is less prominent in the LLaMA 2 models.
### Interpretation
The data suggests a systematic evolution of the measured metric ("Depthwise Average MIN-K%") through the layers of these transformer models. The consistent increase from Depth 1 to Depth 3 implies that this metric, which likely relates to activation sparsity or importance, becomes more pronounced in deeper layers. This could reflect the model's architectural design where deeper layers perform more specialized or refined processing.
The narrowing of distributions and sharper score gap peaks in LLaMA 3 models indicate improved training stability or more uniform layer-wise behavior compared to LLaMA 2. The concentration of the score gap around zero for larger models suggests that adjacent deep layers contribute more equally, potentially avoiding redundancy or drastic functional shifts.
The anomaly in LLaMA 3 70B Instruct's score gap distribution (plot g) is particularly interesting. The secondary peak in the negative region for the 75th percentile could indicate a specific subset of tasks or prompts where the model's behavior regresses or changes character between Depth 2 and Depth 3. This warrants further investigation to understand if it corresponds to a failure mode, a specialized capability, or an artifact of the metric.
Overall, these charts provide a technical lens into the internal layer-wise dynamics of LLaMA models, highlighting trends in metric progression, inter-layer consistency, and potential areas of behavioral divergence.
DECODING INTELLIGENCE...