## Box Plots: Depthwise Average MIN-K%
### Overview
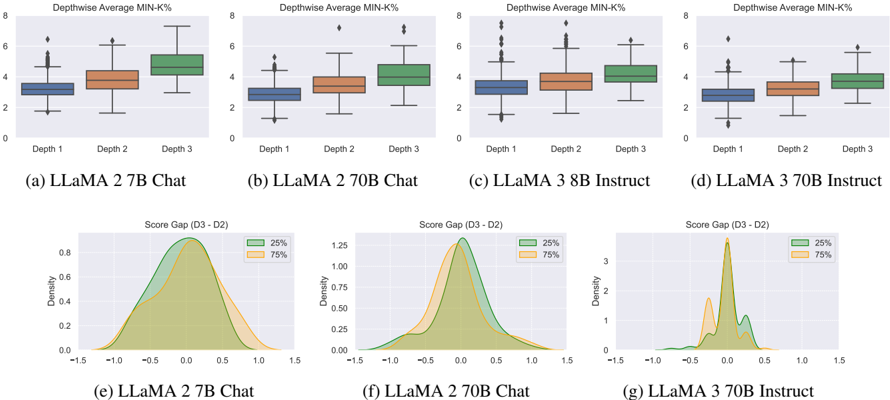
The image contains four box plots (a–d) comparing "Depthwise Average MIN-K%" across three depths (Depth 1, 2, 3) for different LLaMA models and tasks. Each plot uses distinct colors (blue, orange, green) for visual differentiation.
### Components/Axes
- **X-axis**: Depth (1, 2, 3)
- **Y-axis**: Depthwise Average MIN-K% (range: 0–6)
- **Legends**: No explicit legend for box plots; colors (blue, orange, green) are used for visual distinction.
- **Titles**:
- (a) LLaMA 2 7B Chat
- (b) LLaMA 2 70B Chat
- (c) LLaMA 3 8B Instruct
- (d) LLaMA 3 70B Instruct
### Detailed Analysis
- **Box Plot Trends**:
- **Depth 1**: Medians range from ~3.5 (a) to ~4.5 (d).
- **Depth 2**: Medians increase slightly (e.g., ~4.0 in a, ~4.5 in d).
- **Depth 3**: Medians rise further (e.g., ~5.0 in a, ~5.5 in d).
- **Outliers**: Scattered points above the upper whiskers, indicating variability.
- **Color Consistency**: Colors (blue, orange, green) are consistent across plots but lack a legend.
### Key Observations
- **Depth Correlation**: Higher depths (3) generally show higher MIN-K% values, suggesting improved performance with depth.
- **Model/Task Variability**: Larger models (e.g., 70B) and instruction-tuned variants (e.g., 3 70B Instruct) exhibit higher medians.
## Density Plots: Score Gap (D3-D2)
### Overview
Three density plots (e–g) visualize the distribution of score gaps between Depth 3 (D3) and Depth 2 (D2) for the same models/tasks as the box plots.
### Components/Axes
- **X-axis**: Score Gap (D3-D2) (range: -1.5 to 1.5)
- **Y-axis**: Density (0–1.25)
- **Legends**:
- Green: 25% percentile
- Orange: 75% percentile
- **Titles**:
- (e) LLaMA 2 7B Chat
- (f) LLaMA 2 70B Chat
- (g) LLaMA 3 70B Instruct
### Detailed Analysis
- **Density Trends**:
- **25% (Green)**: Peaks near 0.5–1.0, indicating most score gaps are positive.
- **75% (Orange)**: Peaks at higher values (e.g., ~1.0–1.5), showing a skew toward larger gaps.
- **Distribution**: Narrower peaks in (e) and (f) vs. sharper, taller peaks in (g), suggesting more concentrated gaps in larger models.
### Key Observations
- **Positive Gaps**: Most score gaps are positive, implying D3 outperforms D2.
- **Model-Specific Patterns**: Larger models (e.g., 70B) show sharper distributions, indicating more consistent performance improvements.
## Interpretation
The data demonstrates that deeper layers (Depth 3) consistently yield higher MIN-K% scores across models and tasks, suggesting improved performance with depth. The score gaps (D3-D2) are predominantly positive, with larger models (e.g., 70B) exhibiting more pronounced and concentrated improvements. The 75% percentile gaps are significantly higher than the 25% percentile, highlighting that a majority of the data lies in the upper range of performance gains. This aligns with the box plot trends, where Depth 3 consistently outperforms shallower depths. The absence of a legend for the box plots limits direct interpretation of color coding, but the density plots’ legend clarifies the percentile distributions.