\n
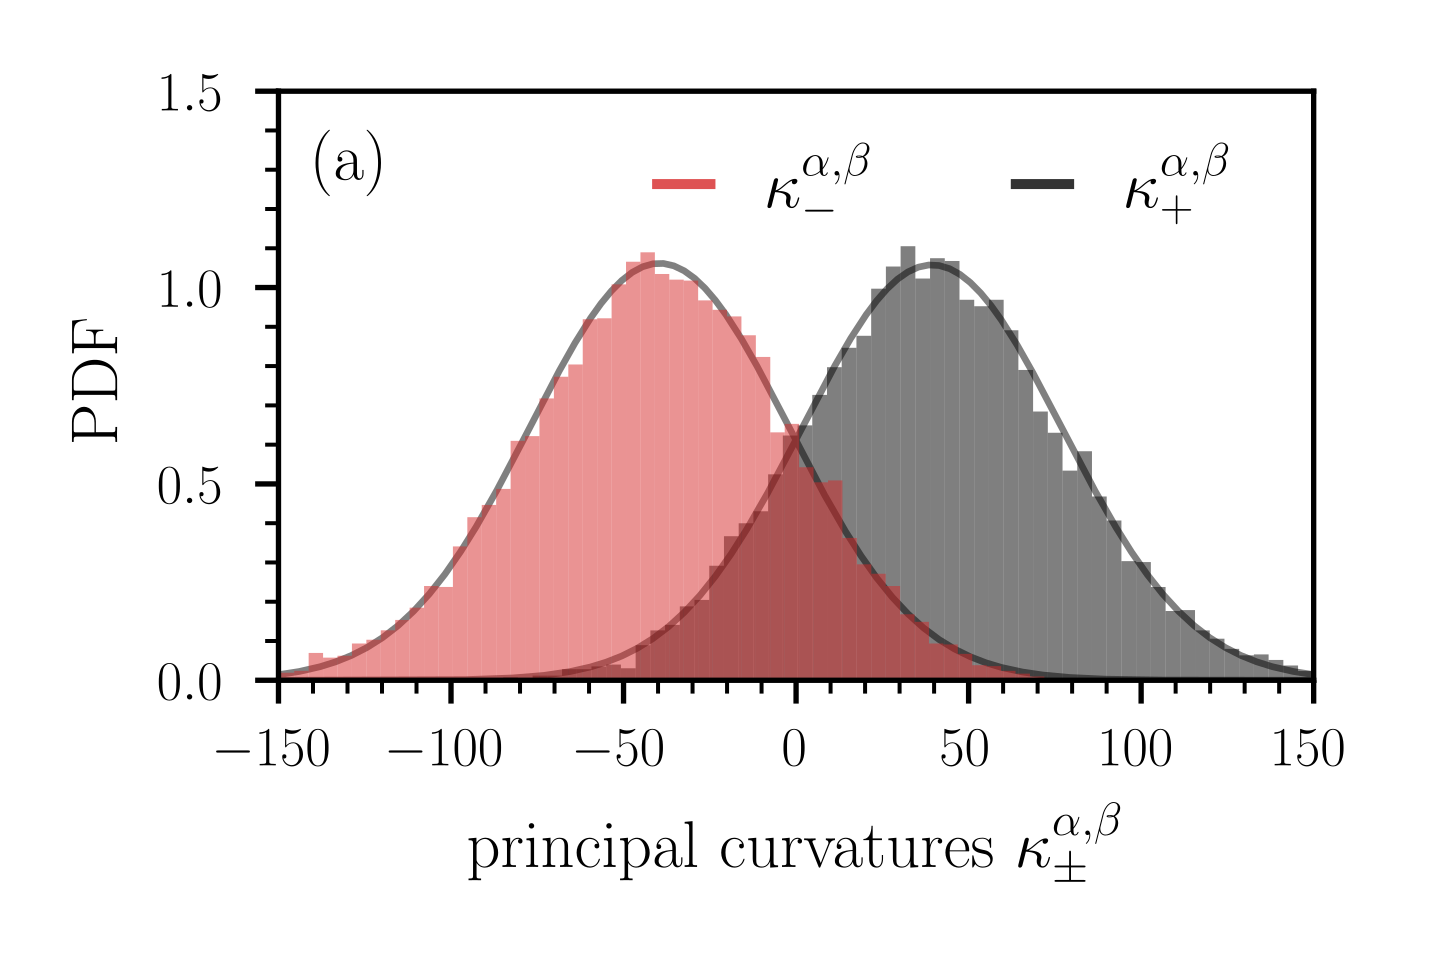
## Chart: Principal Curvature Distribution
### Overview
The image presents a histogram showing the probability density function (PDF) of principal curvatures, denoted as κ±α,β. Two distributions are overlaid: one representing negative principal curvatures (κ−α,β) and the other representing positive principal curvatures (κ+α,β). The distributions appear approximately normal, but with some skewness.
### Components/Axes
* **X-axis:** "principal curvatures κ±α,β". Scale ranges from -150 to 150, with tick marks every 50 units.
* **Y-axis:** "PDF" (Probability Density Function). Scale ranges from 0.0 to 1.5, with tick marks every 0.5 units.
* **Legend:** Located at the top-right of the chart.
* Red dashed line: κ−α,β
* Black solid line: κ+α,β
* **Label (a):** Located at the top-left of the chart.
### Detailed Analysis
The chart displays two overlapping histograms.
**κ−α,β (Red Dashed Line):**
The distribution is centered around approximately -30 to -40. The PDF rises from near 0 at -150, reaches a peak around -30, and then declines back to near 0 at 150. The peak PDF value is approximately 1.05. The distribution is right-skewed.
**κ+α,β (Black Solid Line):**
The distribution is centered around approximately 40 to 50. The PDF rises from near 0 at -150, reaches a peak around 40, and then declines back to near 0 at 150. The peak PDF value is approximately 0.95. The distribution is left-skewed.
The two distributions overlap significantly between approximately -20 and 80.
### Key Observations
* The negative principal curvatures (κ−α,β) are more spread out and have a higher peak PDF value than the positive principal curvatures (κ+α,β).
* The distributions are not symmetrical around zero, indicating an asymmetry in the principal curvatures.
* There is a noticeable overlap between the two distributions, suggesting that both positive and negative curvatures are present in the data.
### Interpretation
The chart suggests that the principal curvatures are not evenly distributed around zero. The negative curvatures are more prevalent and have a wider range of values than the positive curvatures. This asymmetry could indicate a directional bias or a specific geometric property of the surface or object from which these curvatures were derived. The overlap between the distributions suggests that the surface exhibits both concave and convex regions. The data suggests that the surface is more likely to have negative curvature than positive curvature. The distributions are not perfectly normal, indicating that the curvature values may not follow a simple Gaussian distribution. This could be due to the presence of outliers or a more complex underlying process generating the curvatures.