## Probability Density Function (PDF) Plot: Principal Curvatures
### Overview
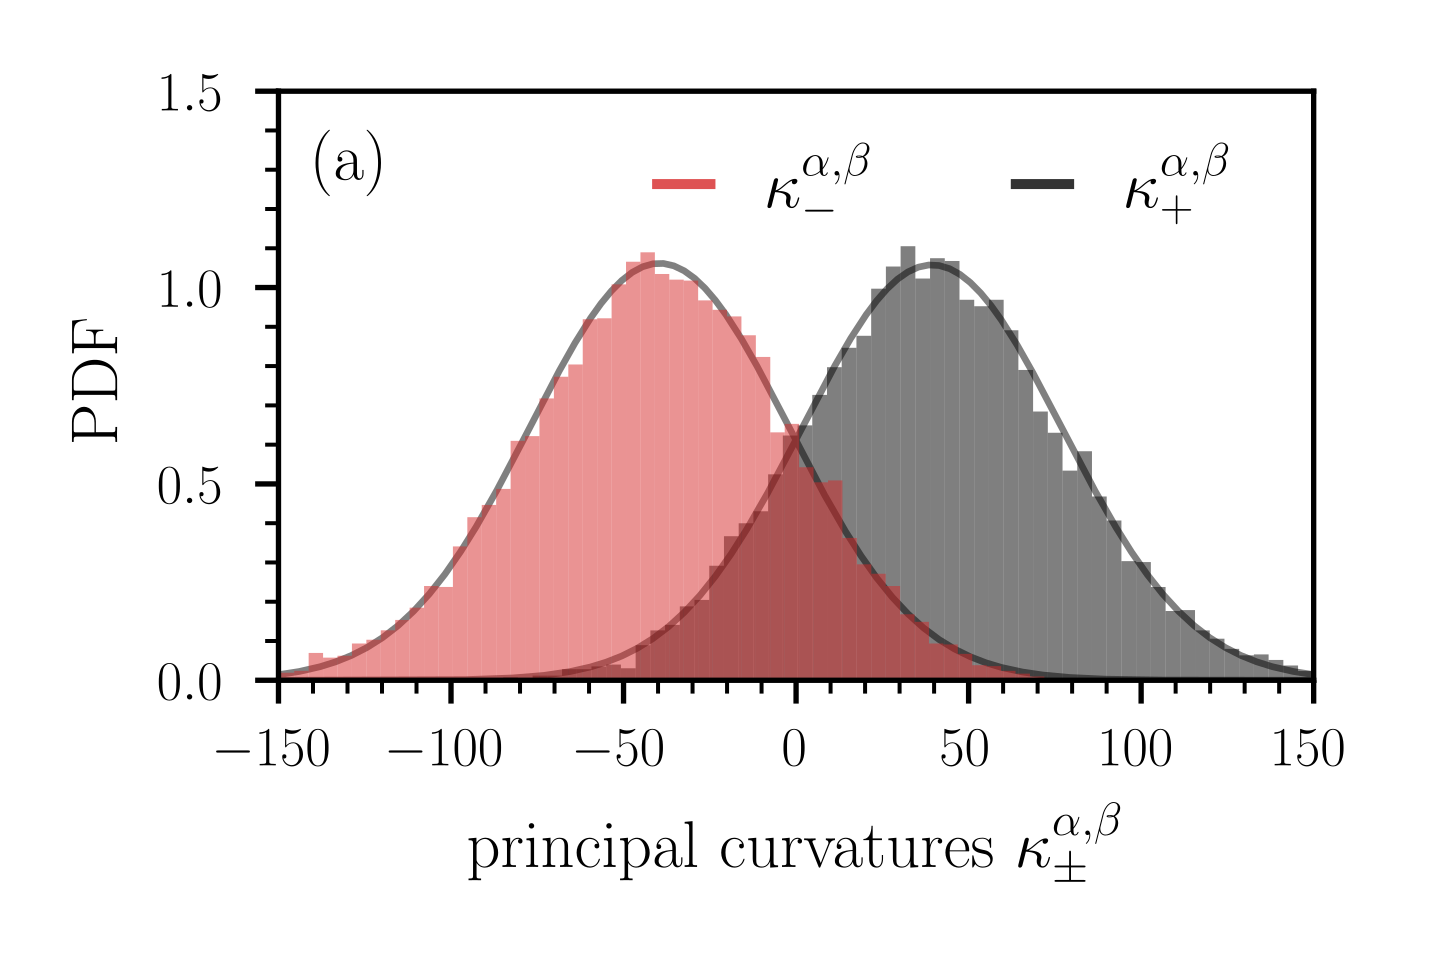
The image is a scientific plot, specifically a probability density function (PDF) histogram with overlaid smooth curves. It displays the distribution of two related quantities, labeled as principal curvatures, on a single set of axes. The plot is labeled "(a)" in the top-left corner, suggesting it is part of a multi-panel figure.
### Components/Axes
* **Chart Type:** Histogram with overlaid probability density curves.
* **Panel Label:** "(a)" located in the top-left corner of the plot area.
* **X-Axis:**
* **Title:** `principal curvatures κ±α,β` (The notation uses Greek letters kappa (κ) with subscripts ± and superscripts α,β).
* **Scale:** Linear scale.
* **Range:** Approximately -150 to +150.
* **Major Tick Marks & Labels:** -150, -100, -50, 0, 50, 100, 150.
* **Y-Axis:**
* **Title:** `PDF` (Probability Density Function).
* **Scale:** Linear scale.
* **Range:** 0.0 to 1.5.
* **Major Tick Marks & Labels:** 0.0, 0.5, 1.0, 1.5.
* **Legend:** Located in the top-right quadrant of the plot area.
* **Entry 1:** A red line segment followed by the label `κ-α,β`. This corresponds to the red histogram and the overlaid red curve.
* **Entry 2:** A black line segment followed by the label `κ+α,β`. This corresponds to the gray/black histogram and the overlaid black curve.
### Detailed Analysis
The plot contains two distinct but overlapping data distributions.
1. **Distribution for κ-α,β (Red):**
* **Visual Trend:** This distribution is centered in the negative domain of the x-axis. It has a bell-shaped, roughly symmetric profile.
* **Data Points (Approximate):**
* The histogram bars and the smooth curve peak at an x-value of approximately **-50**.
* The peak PDF value (y-value) at this point is approximately **1.05**.
* The distribution spans from roughly -140 to +20 on the x-axis, with the bulk of the density between -100 and 0.
* The curve approaches a PDF of 0 near x = -150 and x = +50.
2. **Distribution for κ+α,β (Black/Gray):**
* **Visual Trend:** This distribution is centered in the positive domain of the x-axis. It also has a bell-shaped, roughly symmetric profile, mirroring the red distribution.
* **Data Points (Approximate):**
* The histogram bars and the smooth curve peak at an x-value of approximately **+50**.
* The peak PDF value (y-value) at this point is approximately **1.05**, very similar to the peak of the red distribution.
* The distribution spans from roughly -20 to +140 on the x-axis, with the bulk of the density between 0 and +100.
* The curve approaches a PDF of 0 near x = -50 and x = +150.
3. **Overlap Region:**
* The two distributions overlap significantly in the central region around x = 0.
* The area of overlap is visually represented by a darker, brownish-red color, indicating the summation of the red and gray histogram densities in that region.
* The two smooth curves intersect at approximately x = 0, where both have a PDF value of about **0.6**.
### Key Observations
* **Symmetry and Separation:** The two distributions (κ- and κ+) are nearly mirror images of each other, centered symmetrically around zero but offset by approximately ±50 units.
* **Similar Shape and Scale:** Both distributions have very similar shapes (Gaussian-like), widths (standard deviations), and peak heights (~1.05 PDF).
* **Clear Bimodality:** The combined data shows a clear bimodal distribution, with two distinct peaks separated by a valley near zero.
* **Notable Outliers:** There are no extreme outliers visible; the data tails off smoothly on both ends for each distribution.
### Interpretation
This plot demonstrates the statistical distribution of two opposing principal curvature values (κ- and κ+) for a given system or surface, characterized by parameters α and β.
* **What the data suggests:** The system exhibits a strong tendency to have curvatures of opposite signs. Surfaces or points are much more likely to have one positive and one negative principal curvature (saddle-like geometry) than two curvatures of the same sign. The clear separation of the peaks indicates that the magnitudes of these curvatures are typically non-zero and centered around a characteristic scale (±50 in these units).
* **How elements relate:** The perfect symmetry of the red and black distributions implies a fundamental balance or pairing in the underlying physical or mathematical model. The parameter sets (α,β) likely define a condition where positive and negative curvatures are equally probable and similarly distributed in magnitude.
* **Notable patterns/anomalies:** The most significant pattern is the pronounced bimodality with a minimum at zero curvature. This suggests that "flat" or "minimal" curvature states (κ ≈ 0) are relatively rare in this dataset. The overlap at zero indicates a non-zero probability of finding points where one curvature is zero, but the dominant behavior is the coexistence of distinct positive and negative curvatures.
**Language Declaration:** All text in the image is in English, with mathematical notation using Greek letters (κ, α, β).