## Line Graph: Probability Density Functions of Principal Curvatures
### Overview
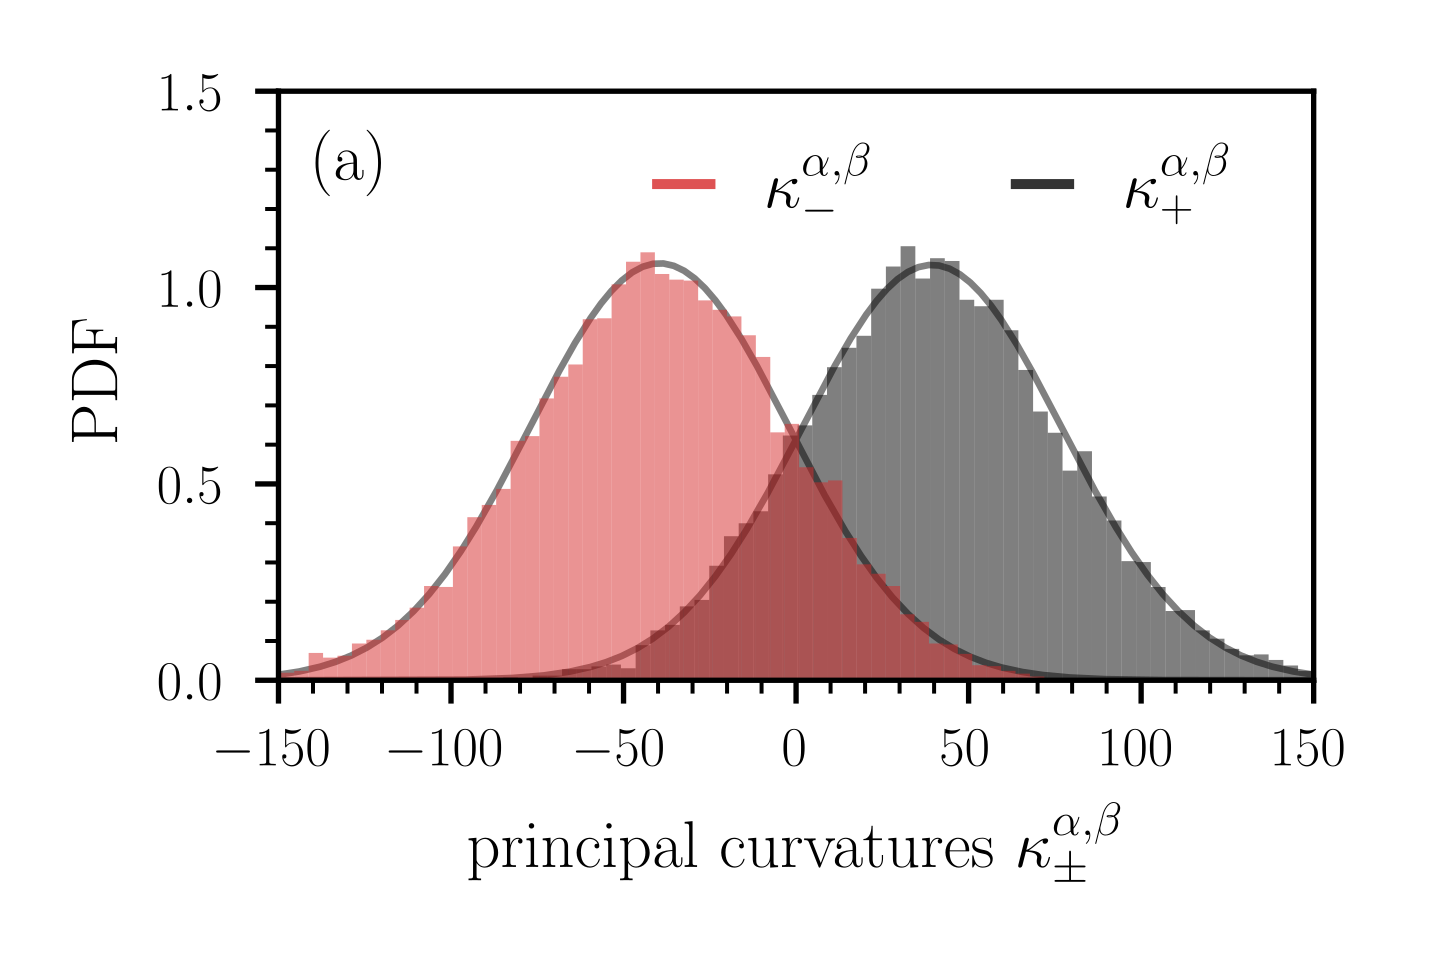
The graph displays two probability density functions (PDFs) for principal curvatures, labeled as κ_-^α,β (red) and κ_+^α,β (black). The x-axis represents principal curvatures (κ_±^α,β), ranging from -150 to 150, while the y-axis shows the PDF, ranging from 0.0 to 1.5. The curves are plotted with distinct colors and overlap in the central region.
### Components/Axes
- **X-axis**: "principal curvatures κ_±^α,β" (range: -150 to 150, increments of 50).
- **Y-axis**: "PDF" (range: 0.0 to 1.5, increments of 0.5).
- **Legend**: Located at the top-right corner, with:
- Red line: κ_-^α,β
- Black line: κ_+^α,β
- **Title**: "(a)" in the top-left corner.
### Detailed Analysis
1. **κ_-^α,β (Red Curve)**:
- Peaks at approximately -50 on the x-axis.
- PDF reaches ~1.0 at its peak.
- Tapers off symmetrically toward both ends of the x-axis.
- Overlaps with κ_+^α,β between -50 and 50.
2. **κ_+^α,β (Black Curve)**:
- Peaks at approximately +50 on the x-axis.
- PDF reaches ~1.0 at its peak.
- Tapers off symmetrically toward both ends of the x-axis.
- Overlaps with κ_-^α,β between -50 and 50.
3. **Overlap Region**:
- Between -50 and 50, both curves intersect, suggesting shared probability density in this range.
### Key Observations
- The distributions are symmetric about the origin (0), indicating mirrored behavior for κ_- and κ_+.
- The PDFs for κ_- and κ_+ are identical in shape but shifted oppositely along the x-axis.
- The maximum PDF value (~1.0) occurs at the peaks of both curves, confirming normalized distributions.
### Interpretation
The graph likely represents the statistical distribution of principal curvatures in a system where positive and negative curvatures are equally probable but occur in opposite directions. The overlap between -50 and 50 suggests a transitional zone where both curvature types coexist or interact. This could reflect phenomena in materials science (e.g., stress distribution in curved surfaces) or geometry (e.g., saddle points in manifolds). The symmetry implies no inherent bias toward positive or negative curvatures in the modeled system.