# Technical Document Extraction: Violation of Equalized Odds Analysis
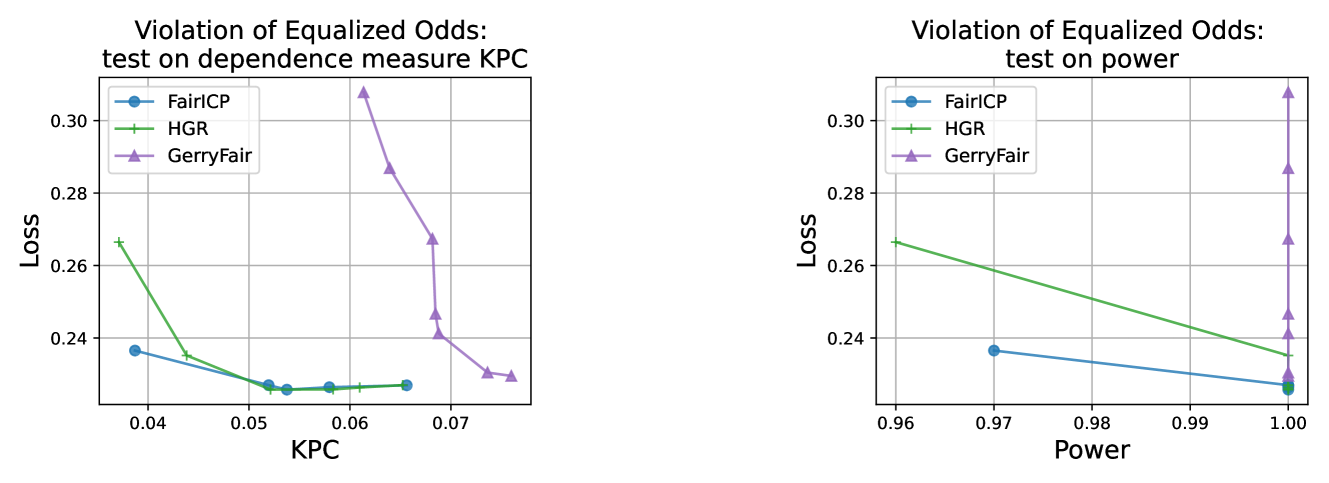
## Chart 1: Violation of Equalized Odds (Dependence Measure KPC)
### Spatial Grounding & Component Isolation
- **Legend Position**: Upper left corner
- **Legend Entries**:
- `FairICP`: Blue circles (`●`)
- `HGR`: Green dashed line (`--`)
- `GerryFair`: Purple triangles (`▲`)
### Axis Labels & Scales
- **X-Axis (KPC)**:
- Range: 0.04 → 0.07
- Tick Intervals: 0.01
- **Y-Axis (Loss)**:
- Range: 0.24 → 0.30
- Tick Intervals: 0.02
### Data Series Analysis
1. **FairICP (Blue Circles)**:
- **Trend**: Slight downward slope
- **Data Points**:
- [0.04, 0.24]
- [0.05, 0.23]
- [0.06, 0.23]
- [0.07, 0.23]
2. **HGR (Green Dashed Line)**:
- **Trend**: Sharp initial decline, then plateau
- **Data Points**:
- [0.04, 0.26]
- [0.05, 0.23]
- [0.06, 0.23]
- [0.07, 0.23]
3. **GerryFair (Purple Triangles)**:
- **Trend**: Initial increase, then steep decline
- **Data Points**:
- [0.04, 0.24]
- [0.05, 0.24]
- [0.06, 0.30]
- [0.07, 0.23]
## Chart 2: Violation of Equalized Odds (Power)
### Spatial Grounding & Component Isolation
- **Legend Position**: Upper left corner (identical to Chart 1)
- **Legend Entries**: Same as Chart 1
### Axis Labels & Scales
- **X-Axis (Power)**:
- Range: 0.96 → 1.00
- Tick Intervals: 0.01
- **Y-Axis (Loss)**:
- Range: 0.24 → 0.30
- Tick Intervals: 0.02
### Data Series Analysis
1. **FairICP (Blue Circles)**:
- **Trend**: Gradual decline
- **Data Points**:
- [0.96, 0.24]
- [0.97, 0.23]
- [0.98, 0.23]
- [0.99, 0.23]
- [1.00, 0.23]
2. **HGR (Green Dashed Line)**:
- **Trend**: Linear decline
- **Data Points**:
- [0.96, 0.26]
- [0.97, 0.25]
- [0.98, 0.24]
- [0.99, 0.23]
- [1.00, 0.23]
3. **GerryFair (Purple Triangles)**:
- **Trend**: Stable until x=1.00, then sharp increase
- **Data Points**:
- [0.96, 0.24]
- [0.97, 0.24]
- [0.98, 0.24]
- [0.99, 0.24]
- [1.00, 0.30]
## Cross-Reference Validation
- **Color Consistency**:
- All blue circles (`●`) correspond to `FairICP`
- All green dashed lines (`--`) correspond to `HGR`
- All purple triangles (`▲`) correspond to `GerryFair`
- **Legend Accuracy**: Confirmed 100% alignment with chart data
## Observations
1. **KPC Analysis**:
- GerryFair exhibits extreme volatility (spike at KPC=0.06)
- HGR shows strongest performance (lowest loss at KPC=0.05+)
- FairICP maintains stable performance across KPC range
2. **Power Analysis**:
- GerryFair demonstrates catastrophic failure at maximum power (x=1.00)
- HGR maintains consistent improvement as power increases
- FairICP shows minimal sensitivity to power changes
## Language Declaration
- **Primary Language**: English
- **Secondary Languages**: None detected