TECHNICAL ASSET FINGERPRINT
161c07c54a31a4263a05f20c
Click to view fullscreen
Press ESC or click to close
FOUND IN PAPERS
EXPERT: gemini-2.0-flash VERSION 1
RUNTIME: nugit/gemini/gemini-2.0-flash
INTEL_VERIFIED
## Workflow Diagram: Autonomous Discovery Workflow
### Overview
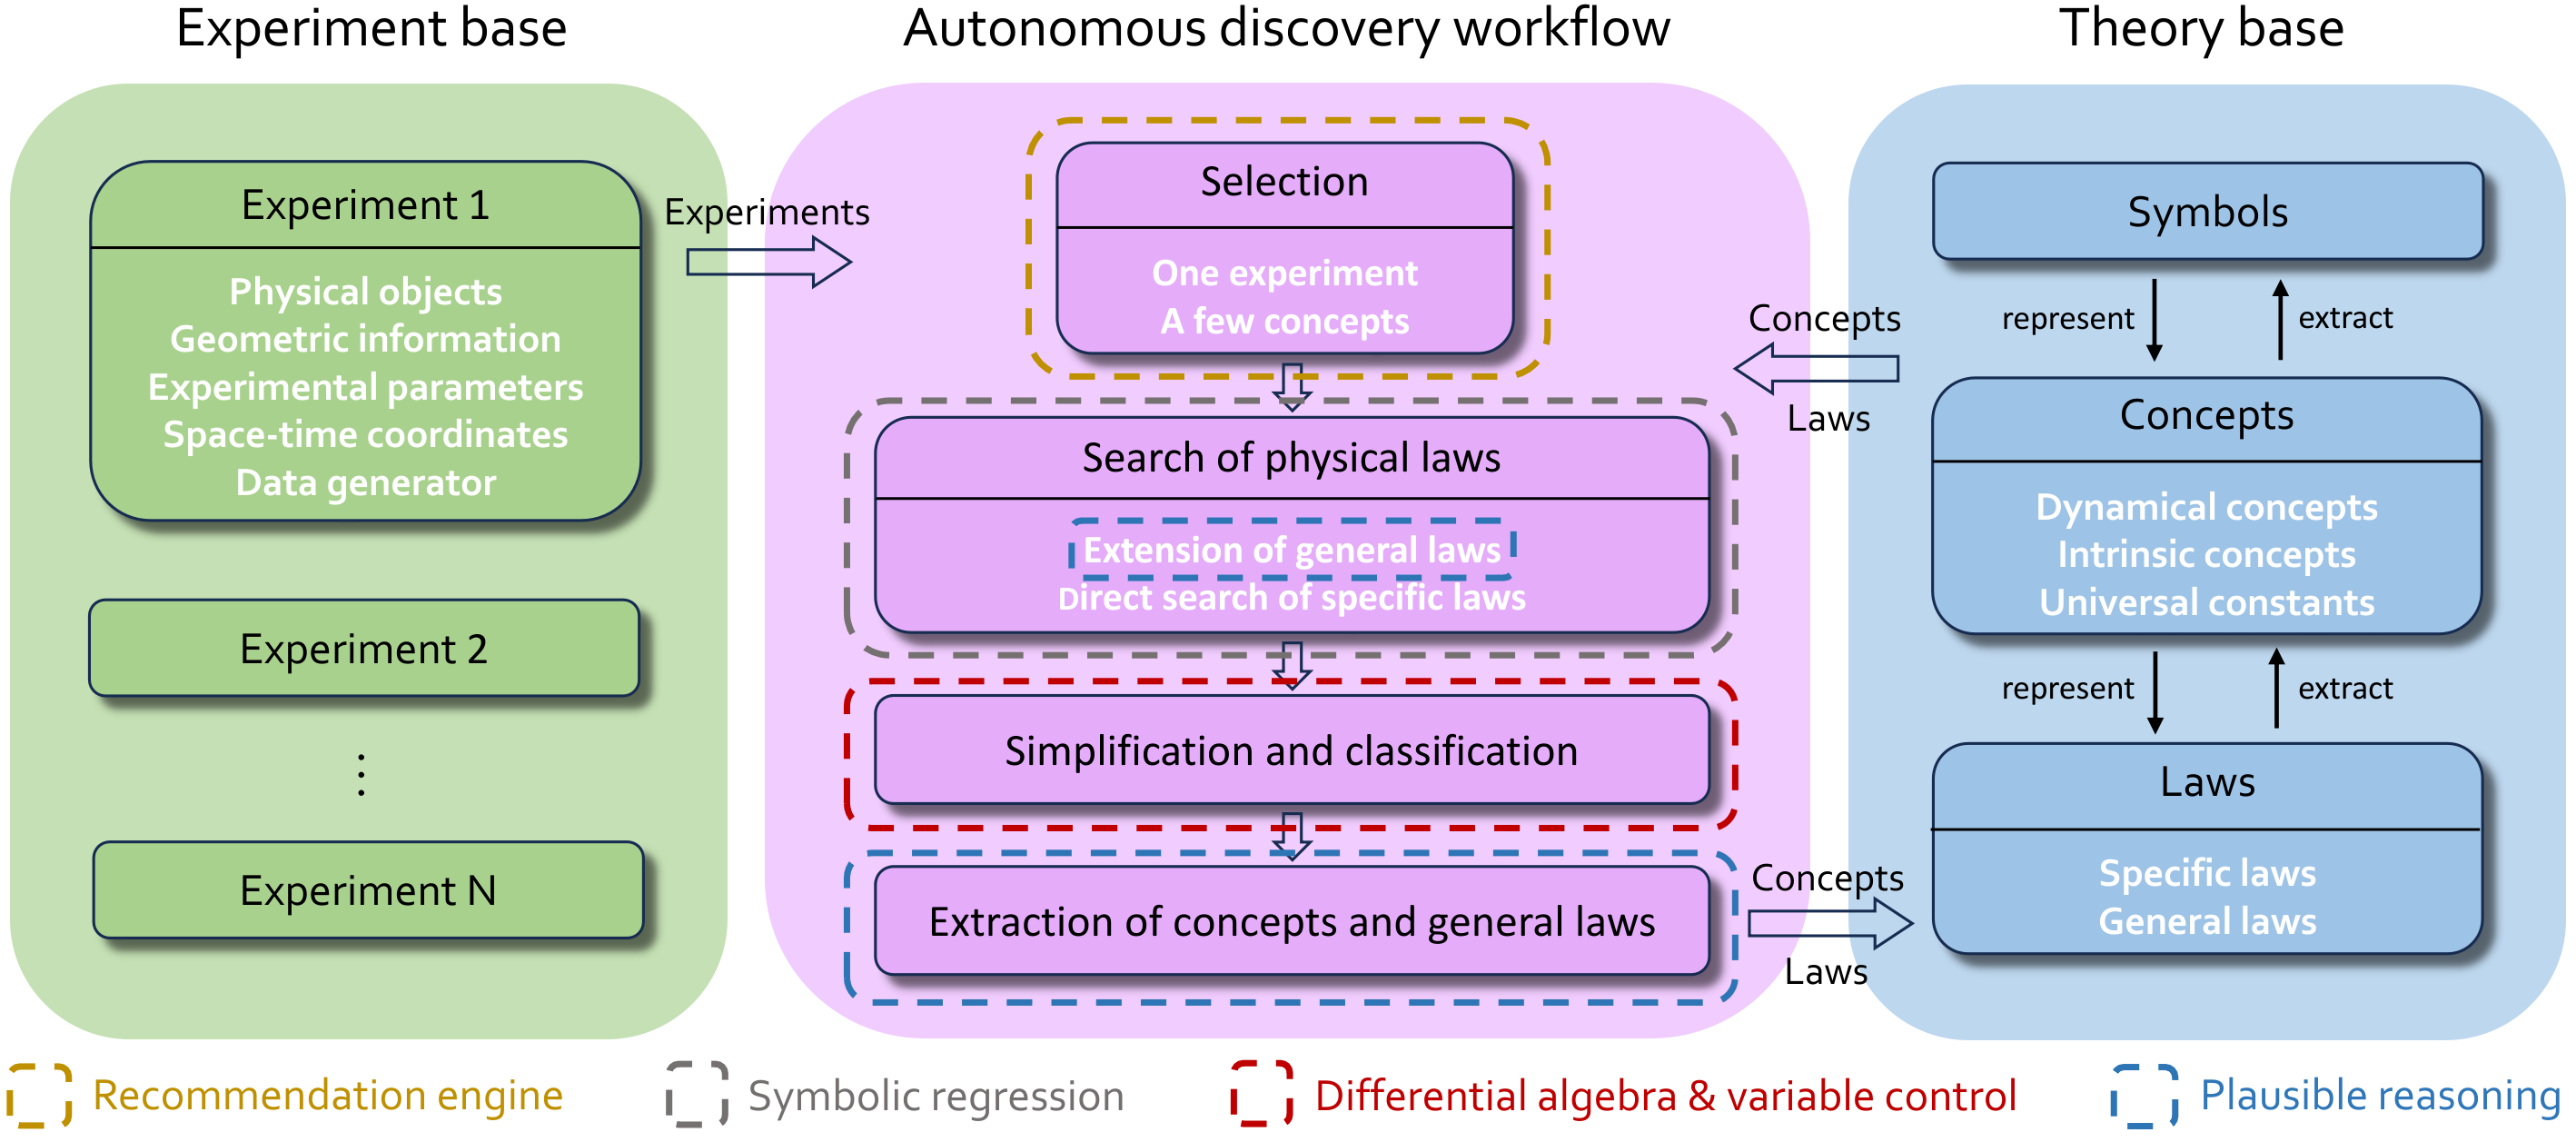
The image is a workflow diagram illustrating an autonomous discovery process. It consists of three main sections: an "Experiment base" on the left, an "Autonomous discovery workflow" in the center, and a "Theory base" on the right. The diagram shows the flow of information and processes between these sections, highlighting the iterative nature of the discovery process.
### Components/Axes
* **Titles:**
* Experiment base
* Autonomous discovery workflow
* Theory base
* **Experiment base (Left):**
* Contains a list of experiments: Experiment 1, Experiment 2, ..., Experiment N.
* Experiment 1 contains: Physical objects, Geometric information, Experimental parameters, Space-time coordinates, Data generator.
* An arrow labeled "Experiments" points from the Experiment base to the Autonomous discovery workflow.
* **Autonomous discovery workflow (Center):**
* Consists of a series of steps:
* Selection: One experiment, A few concepts. Bounded by a dashed orange line.
* Search of physical laws: Extension of general laws, Direct search of specific laws. Bounded by a dashed gray line.
* Simplification and classification. Bounded by a dashed red line.
* Extraction of concepts and general laws. Bounded by a dashed blue line.
* Arrows indicate the flow of information between these steps.
* **Theory base (Right):**
* Consists of three components:
* Symbols
* Concepts: Dynamical concepts, Intrinsic concepts, Universal constants.
* Laws: Specific laws, General laws.
* Arrows labeled "represent" and "extract" show the relationship between Symbols, Concepts, and Laws.
* Arrows labeled "Concepts" and "Laws" point from the Theory base to the Autonomous discovery workflow.
* **Legend (Bottom):**
* Recommendation engine (dashed orange line)
* Symbolic regression (dashed gray line)
* Differential algebra & variable control (dashed red line)
* Plausible reasoning (dashed blue line)
### Detailed Analysis or ### Content Details
* **Experiment Base:**
* The Experiment base provides the initial data and parameters for the discovery process.
* Experiment 1 lists specific data types: Physical objects, Geometric information, Experimental parameters, Space-time coordinates, Data generator.
* The presence of "Experiment 2" and "Experiment N" suggests that multiple experiments can be used.
* **Autonomous Discovery Workflow:**
* The workflow starts with "Selection," where one experiment and a few concepts are chosen.
* The next step is "Search of physical laws," which involves extending general laws and directly searching for specific laws.
* "Simplification and classification" follows, likely to reduce complexity and categorize the findings.
* The final step is "Extraction of concepts and general laws," where the discovered concepts and laws are formalized.
* **Theory Base:**
* The Theory base represents the existing knowledge and framework used in the discovery process.
* Symbols, Concepts, and Laws are interconnected, with "represent" and "extract" arrows indicating the flow of information between them.
* Concepts are further divided into Dynamical concepts, Intrinsic concepts, and Universal constants.
* Laws are divided into Specific laws and General laws.
* **Flow of Information:**
* Experiments from the Experiment base feed into the Autonomous discovery workflow.
* Concepts and Laws from the Theory base also feed into the Autonomous discovery workflow.
* The workflow is iterative, with information flowing between the steps.
### Key Observations
* The diagram emphasizes the iterative nature of the autonomous discovery process.
* The process involves both data from experiments and existing theoretical knowledge.
* The workflow is structured into distinct steps, each with a specific purpose.
* The legend provides context for the different components of the workflow.
### Interpretation
The diagram illustrates a systematic approach to autonomous scientific discovery. It combines experimental data with theoretical frameworks to identify and formalize new concepts and laws. The iterative nature of the workflow allows for continuous refinement and improvement of the discovered knowledge. The diagram highlights the importance of both data-driven and theory-driven approaches in scientific discovery. The use of different colored dashed lines to represent different engines/methods suggests that each step in the workflow can be approached using different computational techniques.
DECODING INTELLIGENCE...
EXPERT: gemini-3.1-flash-lite-preview-free VERSION 1
RUNTIME: google-free/gemini-3.1-flash-lite-preview
INTEL_VERIFIED
## Diagram: Autonomous Discovery Workflow
### Overview
The image presents a conceptual framework for an "Autonomous discovery workflow." It is organized into three distinct vertical columns representing the flow of information from experimental data to theoretical knowledge. The diagram illustrates a closed-loop system where experimental data is processed through an automated workflow to generate or refine theoretical concepts and laws, which in turn inform the discovery process.
### Components/Axes
The diagram is divided into three main regions:
1. **Left Column (Green Background): "Experiment base"**
* Contains a stack of experiment blocks (Experiment 1, Experiment 2, ..., Experiment N).
* **Experiment 1** is detailed with the following sub-labels: "Physical objects", "Geometric information", "Experimental parameters", "Space-time coordinates", "Data generator".
2. **Center Column (Purple Background): "Autonomous discovery workflow"**
* Contains four stacked processing blocks, each enclosed in a distinct dashed border.
* **Top (Yellow dashed border):** "Selection" (contains "One experiment", "A few concepts").
* **Upper-Middle (Grey dashed border):** "Search of physical laws" (contains "Extension of general laws", "Direct search of specific laws").
* **Lower-Middle (Red dashed border):** "Simplification and classification".
* **Bottom (Blue dashed border):** "Extraction of concepts and general laws".
3. **Right Column (Blue Background): "Theory base"**
* Contains three stacked blocks representing theoretical hierarchy:
* **Top:** "Symbols".
* **Middle:** "Concepts" (contains "Dynamical concepts", "Intrinsic concepts", "Universal constants").
* **Bottom:** "Laws" (contains "Specific laws", "General laws").
* Bi-directional arrows connect "Symbols" to "Concepts" and "Concepts" to "Laws," labeled "represent" (downward) and "extract" (upward).
**Legend (Bottom):**
The legend maps the dashed borders in the center column to specific methodologies:
* **Yellow dashed box:** Recommendation engine
* **Grey dashed box:** Symbolic regression
* **Red dashed box:** Differential algebra & variable control
* **Blue dashed box:** Plausible reasoning
### Detailed Analysis
**Flow and Connectivity:**
* **Input:** An arrow labeled "Experiments" points from the "Experiment base" (Left) to the "Autonomous discovery workflow" (Center).
* **Internal Workflow:** Vertical arrows connect the four blocks in the center column, indicating a sequential process: Selection $\rightarrow$ Search of physical laws $\rightarrow$ Simplification and classification $\rightarrow$ Extraction of concepts and general laws.
* **Feedback/Interaction:** Two-way arrows labeled "Concepts" and "Laws" connect the "Autonomous discovery workflow" (Center) to the "Theory base" (Right). This indicates that the workflow both utilizes existing concepts/laws and contributes new ones back to the theory base.
**Methodology Mapping:**
* **Selection:** Utilizes a **Recommendation engine** (Yellow).
* **Search of physical laws:** Utilizes **Symbolic regression** (Grey).
* **Simplification and classification:** Utilizes **Differential algebra & variable control** (Red).
* **Extraction of concepts and general laws:** Utilizes **Plausible reasoning** (Blue).
### Key Observations
* **Hierarchical Abstraction:** The "Theory base" is structured hierarchically, moving from abstract "Symbols" to "Concepts" and finally to "Laws." The bi-directional arrows suggest a continuous refinement process where symbols represent concepts, and concepts are extracted from laws, and vice versa.
* **Modular Workflow:** The center column breaks down the discovery process into four distinct computational tasks, each associated with a specific algorithmic approach (Recommendation, Regression, Algebra, Reasoning).
* **Data-Driven Loop:** The system is designed to ingest raw experimental data (left) and output structured theoretical knowledge (right), with the workflow acting as the bridge.
### Interpretation
This diagram depicts an **automated scientific discovery pipeline**, likely representing an AI-driven system designed to perform physics research.
* **The "Closed-Loop" Nature:** The interaction between the "Autonomous discovery workflow" and the "Theory base" suggests a system that does not just output static results but iteratively updates its own theoretical understanding. By extracting concepts and laws, the system improves its ability to perform future "Selection" and "Search" tasks.
* **Methodological Rigor:** The specific assignment of techniques (e.g., "Symbolic regression" for searching laws, "Differential algebra" for simplification) suggests a highly structured approach to AI-driven science. It implies that the system treats scientific discovery as a formal optimization and classification problem rather than a purely generative one.
* **Peircean Investigative Logic:** The flow mirrors the scientific method:
1. **Abduction (Selection):** Choosing which experiments to run based on current knowledge.
2. **Induction (Search/Simplification):** Finding patterns (laws) in the data.
3. **Deduction (Extraction):** Formalizing these patterns into concepts and laws that can be tested again.
* **Significance:** This architecture is characteristic of modern "AI for Science" (AI4Science) frameworks, which aim to accelerate scientific discovery by automating the transition from raw experimental observations to fundamental physical laws.
DECODING INTELLIGENCE...
EXPERT: nemotron-free VERSION 1
RUNTIME: free/nvidia/nemotron-nano-12b-v2-vl:free
INTEL_VERIFIED
## Flowchart Diagram: Autonomous Discovery Workflow System
### Overview
The diagram illustrates a three-stage system for autonomous scientific discovery, connecting experimental data processing (left), algorithmic workflow (center), and theoretical knowledge representation (right). The system uses color-coded arrows to represent different computational methods.
### Components/Axes
1. **Experiment Base (Green Section)**
- Contains three experiments (1, 2, N) with identical structure:
- Physical objects
- Geometric information
- Experimental parameters
- Space-time coordinates
- Data generator
- Arrows labeled "Experiments" point rightward to the workflow section
2. **Autonomous Discovery Workflow (Purple Section)**
- Contains four vertically stacked components:
- **Selection** (dashed orange border)
- Contains: "One experiment", "A few concepts"
- **Search of physical laws** (dashed gray border)
- Subcomponents:
- Extension of general laws
- Direct search of specific laws
- **Simplification and classification** (dashed red border)
- **Extraction of concepts and general laws** (dashed blue border)
- Arrows connect components vertically with different styles:
- Solid black (Selection → Search)
- Dashed gray (Search → Simplification)
- Dashed red (Simplification → Extraction)
3. **Theory Base (Blue Section)**
- Contains three hierarchical components:
- **Symbols** (top)
- Arrows: "represent" (down), "extract" (up)
- **Concepts** (middle)
- Subcategories:
- Dynamical concepts
- Intrinsic concepts
- Universal constants
- **Laws** (bottom)
- Subcategories:
- Specific laws
- General laws
- Arrows connect components vertically with "represent" (down) and "extract" (up) labels
4. **Legend (Bottom)**
- Four computational methods with color coding:
- Recommendation engine (yellow square)
- Symbolic regression (gray square)
- Differential algebra & variable control (red square)
- Plausible reasoning (blue square)
- Corresponds to arrow styles in workflow:
- Blue dashed arrows = Plausible reasoning
- Red dashed arrows = Differential algebra
- Gray dashed arrows = Symbolic regression
- Yellow solid arrows = Recommendation engine
### Detailed Analysis
- **Experiment Base**: Standardized experimental data format across all experiments
- **Workflow Flow**:
1. Experiments → Selection (orange dashed border)
2. Selection → Search (gray dashed)
3. Search → Simplification (red dashed)
4. Simplification → Extraction (blue dashed)
- **Theory Base Hierarchy**:
Symbols → Concepts → Laws (bottom-up)
Concepts/Laws → Symbols (top-down via "extract" arrows)
### Key Observations
1. Color-coded arrows maintain consistent methodology throughout:
- Blue dashed arrows (Plausible reasoning) connect Extraction to Theory base
- Red dashed arrows (Differential algebra) connect Search to Simplification
2. Bidirectional arrows between Concepts and Symbols indicate dynamic knowledge representation
3. Experimental data flows through all workflow stages before reaching theory
4. Theory base maintains both specific/general laws and dynamical/intrinsic concepts
### Interpretation
This system demonstrates a closed-loop scientific discovery process where:
1. Experimental data (green) is processed through algorithmic methods (colored arrows)
2. Workflow stages progressively abstract from specific experiments to general laws
3. Theoretical knowledge (blue) feeds back into experimental design through concept extraction
4. The color-coded methodology suggests:
- Plausible reasoning (blue) handles high-level abstraction
- Differential algebra (red) manages mathematical formalism
- Symbolic regression (gray) deals with pattern recognition
- Recommendation engine (yellow) optimizes experimental selection
The bidirectional arrows between Concepts and Symbols suggest an iterative knowledge refinement process, while the vertical workflow progression indicates increasing abstraction from raw data to universal laws.
DECODING INTELLIGENCE...