## Workflow Diagram: Autonomous Discovery Workflow
### Overview
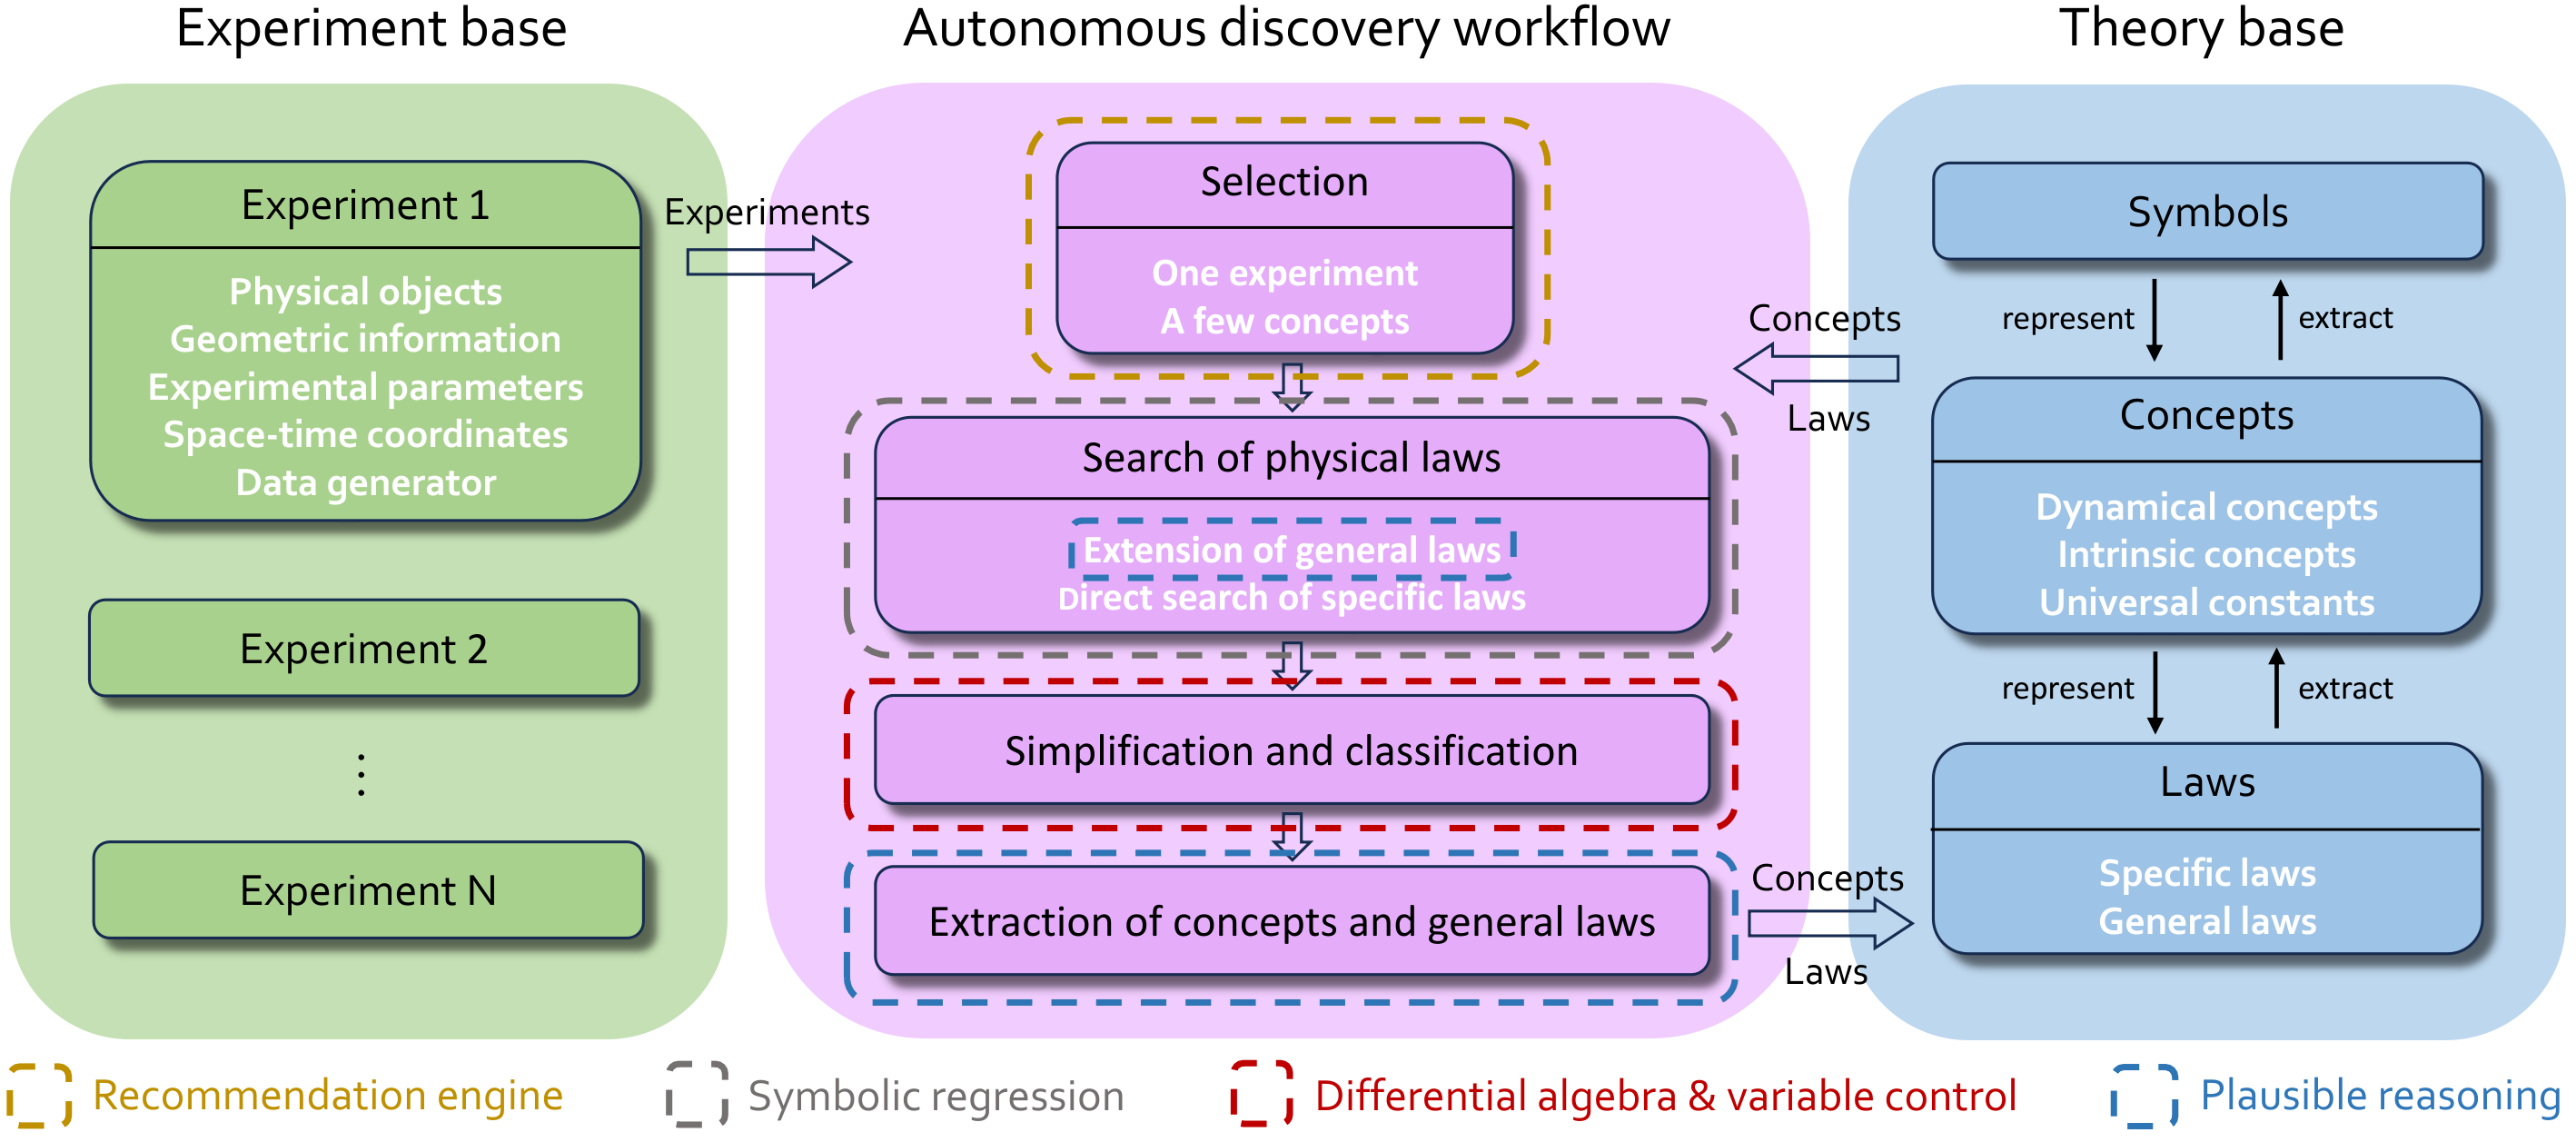
The image is a workflow diagram illustrating an autonomous discovery process. It consists of three main sections: an "Experiment base" on the left, an "Autonomous discovery workflow" in the center, and a "Theory base" on the right. The diagram shows the flow of information and processes between these sections, highlighting the iterative nature of the discovery process.
### Components/Axes
* **Titles:**
* Experiment base
* Autonomous discovery workflow
* Theory base
* **Experiment base (Left):**
* Contains a list of experiments: Experiment 1, Experiment 2, ..., Experiment N.
* Experiment 1 contains: Physical objects, Geometric information, Experimental parameters, Space-time coordinates, Data generator.
* An arrow labeled "Experiments" points from the Experiment base to the Autonomous discovery workflow.
* **Autonomous discovery workflow (Center):**
* Consists of a series of steps:
* Selection: One experiment, A few concepts. Bounded by a dashed orange line.
* Search of physical laws: Extension of general laws, Direct search of specific laws. Bounded by a dashed gray line.
* Simplification and classification. Bounded by a dashed red line.
* Extraction of concepts and general laws. Bounded by a dashed blue line.
* Arrows indicate the flow of information between these steps.
* **Theory base (Right):**
* Consists of three components:
* Symbols
* Concepts: Dynamical concepts, Intrinsic concepts, Universal constants.
* Laws: Specific laws, General laws.
* Arrows labeled "represent" and "extract" show the relationship between Symbols, Concepts, and Laws.
* Arrows labeled "Concepts" and "Laws" point from the Theory base to the Autonomous discovery workflow.
* **Legend (Bottom):**
* Recommendation engine (dashed orange line)
* Symbolic regression (dashed gray line)
* Differential algebra & variable control (dashed red line)
* Plausible reasoning (dashed blue line)
### Detailed Analysis or ### Content Details
* **Experiment Base:**
* The Experiment base provides the initial data and parameters for the discovery process.
* Experiment 1 lists specific data types: Physical objects, Geometric information, Experimental parameters, Space-time coordinates, Data generator.
* The presence of "Experiment 2" and "Experiment N" suggests that multiple experiments can be used.
* **Autonomous Discovery Workflow:**
* The workflow starts with "Selection," where one experiment and a few concepts are chosen.
* The next step is "Search of physical laws," which involves extending general laws and directly searching for specific laws.
* "Simplification and classification" follows, likely to reduce complexity and categorize the findings.
* The final step is "Extraction of concepts and general laws," where the discovered concepts and laws are formalized.
* **Theory Base:**
* The Theory base represents the existing knowledge and framework used in the discovery process.
* Symbols, Concepts, and Laws are interconnected, with "represent" and "extract" arrows indicating the flow of information between them.
* Concepts are further divided into Dynamical concepts, Intrinsic concepts, and Universal constants.
* Laws are divided into Specific laws and General laws.
* **Flow of Information:**
* Experiments from the Experiment base feed into the Autonomous discovery workflow.
* Concepts and Laws from the Theory base also feed into the Autonomous discovery workflow.
* The workflow is iterative, with information flowing between the steps.
### Key Observations
* The diagram emphasizes the iterative nature of the autonomous discovery process.
* The process involves both data from experiments and existing theoretical knowledge.
* The workflow is structured into distinct steps, each with a specific purpose.
* The legend provides context for the different components of the workflow.
### Interpretation
The diagram illustrates a systematic approach to autonomous scientific discovery. It combines experimental data with theoretical frameworks to identify and formalize new concepts and laws. The iterative nature of the workflow allows for continuous refinement and improvement of the discovered knowledge. The diagram highlights the importance of both data-driven and theory-driven approaches in scientific discovery. The use of different colored dashed lines to represent different engines/methods suggests that each step in the workflow can be approached using different computational techniques.