## Flowchart Diagram: Autonomous Discovery Workflow System
### Overview
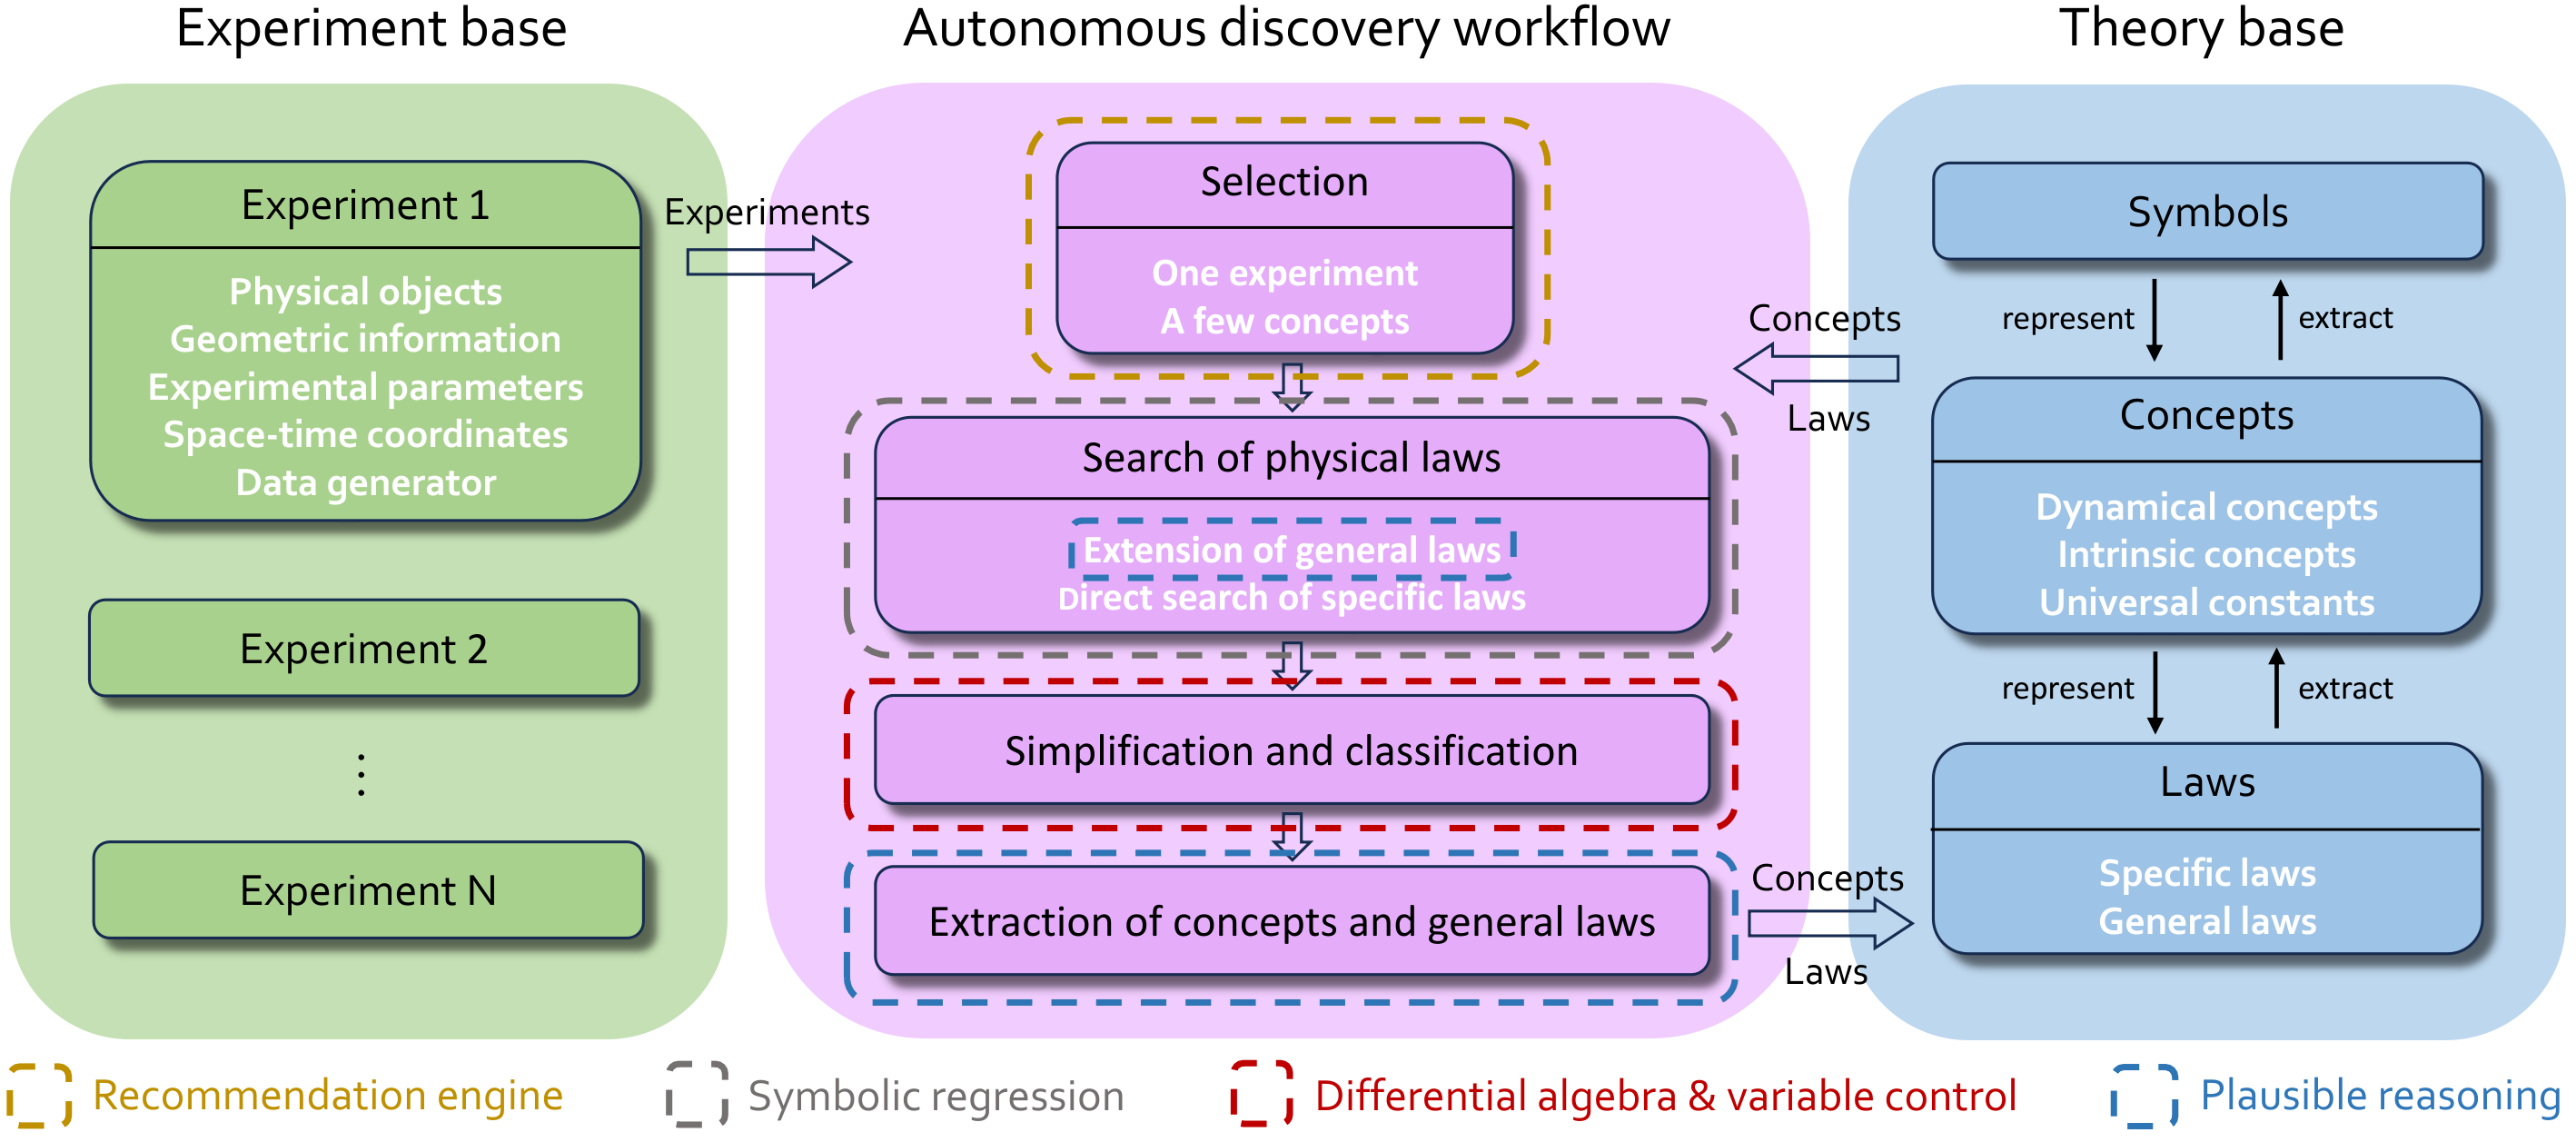
The diagram illustrates a three-stage system for autonomous scientific discovery, connecting experimental data processing (left), algorithmic workflow (center), and theoretical knowledge representation (right). The system uses color-coded arrows to represent different computational methods.
### Components/Axes
1. **Experiment Base (Green Section)**
- Contains three experiments (1, 2, N) with identical structure:
- Physical objects
- Geometric information
- Experimental parameters
- Space-time coordinates
- Data generator
- Arrows labeled "Experiments" point rightward to the workflow section
2. **Autonomous Discovery Workflow (Purple Section)**
- Contains four vertically stacked components:
- **Selection** (dashed orange border)
- Contains: "One experiment", "A few concepts"
- **Search of physical laws** (dashed gray border)
- Subcomponents:
- Extension of general laws
- Direct search of specific laws
- **Simplification and classification** (dashed red border)
- **Extraction of concepts and general laws** (dashed blue border)
- Arrows connect components vertically with different styles:
- Solid black (Selection → Search)
- Dashed gray (Search → Simplification)
- Dashed red (Simplification → Extraction)
3. **Theory Base (Blue Section)**
- Contains three hierarchical components:
- **Symbols** (top)
- Arrows: "represent" (down), "extract" (up)
- **Concepts** (middle)
- Subcategories:
- Dynamical concepts
- Intrinsic concepts
- Universal constants
- **Laws** (bottom)
- Subcategories:
- Specific laws
- General laws
- Arrows connect components vertically with "represent" (down) and "extract" (up) labels
4. **Legend (Bottom)**
- Four computational methods with color coding:
- Recommendation engine (yellow square)
- Symbolic regression (gray square)
- Differential algebra & variable control (red square)
- Plausible reasoning (blue square)
- Corresponds to arrow styles in workflow:
- Blue dashed arrows = Plausible reasoning
- Red dashed arrows = Differential algebra
- Gray dashed arrows = Symbolic regression
- Yellow solid arrows = Recommendation engine
### Detailed Analysis
- **Experiment Base**: Standardized experimental data format across all experiments
- **Workflow Flow**:
1. Experiments → Selection (orange dashed border)
2. Selection → Search (gray dashed)
3. Search → Simplification (red dashed)
4. Simplification → Extraction (blue dashed)
- **Theory Base Hierarchy**:
Symbols → Concepts → Laws (bottom-up)
Concepts/Laws → Symbols (top-down via "extract" arrows)
### Key Observations
1. Color-coded arrows maintain consistent methodology throughout:
- Blue dashed arrows (Plausible reasoning) connect Extraction to Theory base
- Red dashed arrows (Differential algebra) connect Search to Simplification
2. Bidirectional arrows between Concepts and Symbols indicate dynamic knowledge representation
3. Experimental data flows through all workflow stages before reaching theory
4. Theory base maintains both specific/general laws and dynamical/intrinsic concepts
### Interpretation
This system demonstrates a closed-loop scientific discovery process where:
1. Experimental data (green) is processed through algorithmic methods (colored arrows)
2. Workflow stages progressively abstract from specific experiments to general laws
3. Theoretical knowledge (blue) feeds back into experimental design through concept extraction
4. The color-coded methodology suggests:
- Plausible reasoning (blue) handles high-level abstraction
- Differential algebra (red) manages mathematical formalism
- Symbolic regression (gray) deals with pattern recognition
- Recommendation engine (yellow) optimizes experimental selection
The bidirectional arrows between Concepts and Symbols suggest an iterative knowledge refinement process, while the vertical workflow progression indicates increasing abstraction from raw data to universal laws.