## Heatmap: Gemini 1.5 Pro vs GPT-4V Depth Analysis
### Overview
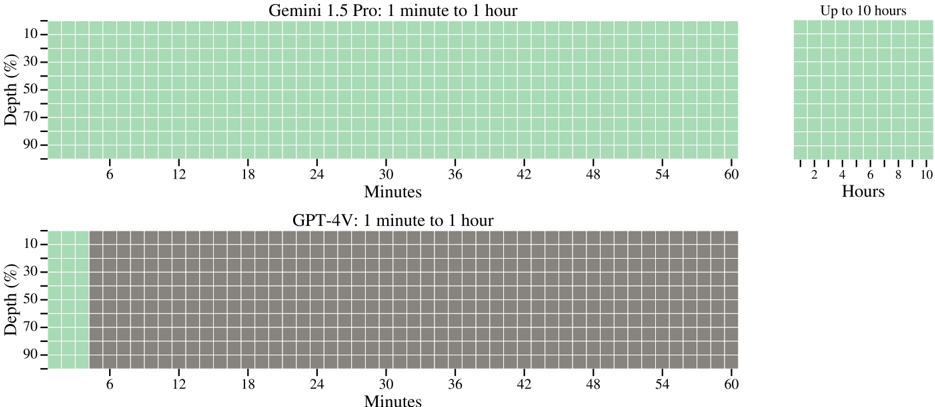
The image contains two primary heatmaps comparing depth percentages over time for Gemini 1.5 Pro and GPT-4V models, with a third inset chart showing extended time ranges. The visual structure uses color-coded grids to represent data distribution across depth and time dimensions.
### Components/Axes
1. **Primary Charts (Gemini 1.5 Pro & GPT-4V)**
- **X-axis**: Time intervals labeled "Minutes" (6, 12, 18, 24, 30, 36, 42, 48, 54, 60)
- **Y-axis**: Depth percentages (10%, 30%, 50%, 70%, 90%)
- **Legend**:
- Green squares labeled "Gemini 1.5 Pro: 1 minute to 1 hour"
- Gray squares labeled "GPT-4V: 1 minute to 1 hour"
- **Grid Structure**: 10x10 matrix per chart with uniform coloration
2. **Inset Chart (Extended Time Range)**
- **X-axis**: Time labeled "Hours" (2, 4, 6, 8, 10)
- **Y-axis**: Depth percentages (10%, 30%, 50%, 70%, 90%)
- **Grid Structure**: 5x5 matrix with uniform coloration
### Detailed Analysis
1. **Gemini 1.5 Pro (Green Grid)**
- Uniform green coloration across all time intervals (6-60 minutes)
- Depth percentages show no variation between 10% and 90%
- Spatial grounding: Green dominates the entire grid, occupying 90% of the chart height
2. **GPT-4V (Gray Grid)**
- Uniform gray coloration across all time intervals (6-60 minutes)
- Depth percentages show no variation between 10% and 90%
- Spatial grounding: Gray occupies the lower 10% of the chart height
3. **Inset Chart**
- Uniform green coloration across 2-10 hour intervals
- Depth percentages show no variation between 10% and 90%
- Spatial grounding: Green occupies the entire inset chart
### Key Observations
1. Both models show **zero variation** in depth percentages across all time intervals
2. The 10% depth band (bottom of charts) remains uncolored in both primary charts
3. Inset chart extends time range to 10 hours but maintains identical depth distribution
4. Color coding strictly follows legend assignments (green=Gemini, gray=GPT-4V)
### Interpretation
The uniform coloration suggests either:
1. **Data Consistency**: Both models maintain identical depth distributions across all measured time intervals
2. **Data Omission**: Missing data points represented by uniform coloration (alternative interpretation)
3. **Visualization Limitation**: The grid structure may be a placeholder for actual data not yet populated
The inset chart's extension to 10 hours implies potential for longitudinal analysis, but the identical grid pattern suggests either:
- No temporal degradation in depth performance
- Incomplete data representation
- Intentional simplification for comparative visualization
The absence of numerical values or gradient variations prevents quantitative analysis, but the strict color separation between models confirms distinct data streams.