## Heatmaps: Reconstruction Comparison
### Overview
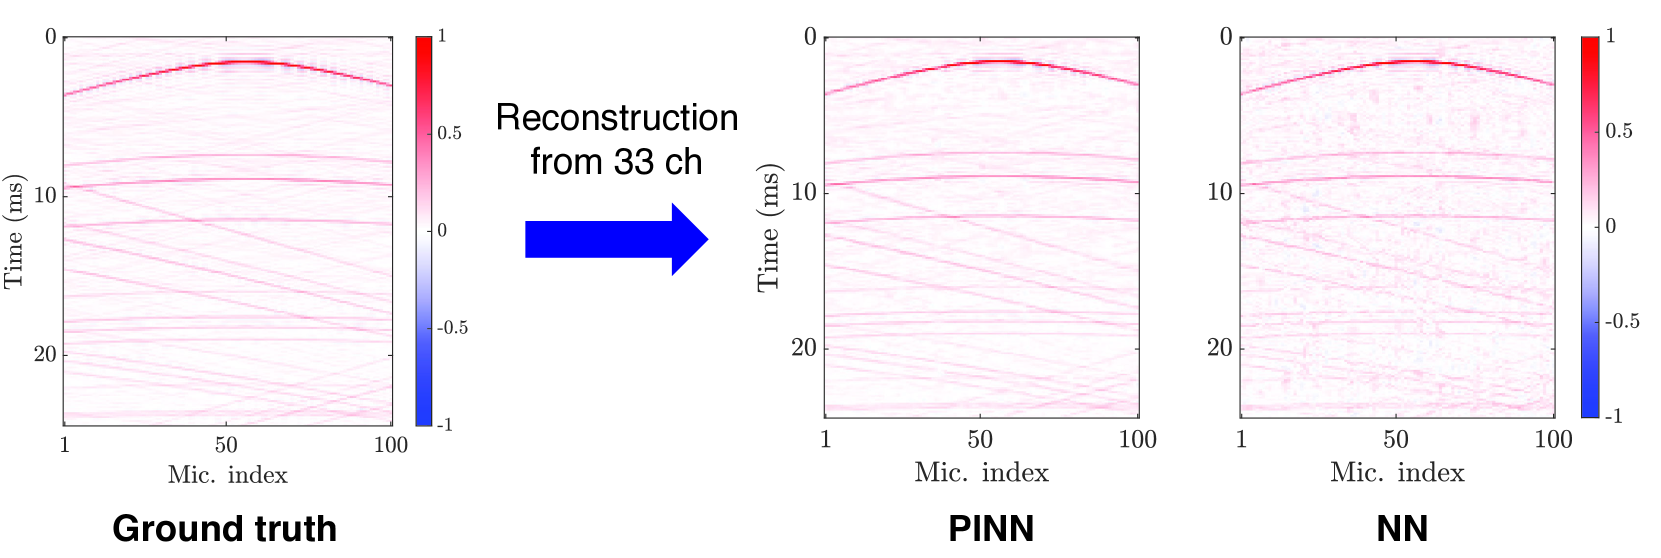
The image presents three heatmaps comparing the "Ground truth" data with reconstructions obtained using two different methods: PINN (Physics-Informed Neural Network) and NN (Neural Network). The heatmaps visualize data related to time (in milliseconds) versus microphone index. A colorbar indicates the data values, ranging from -1 (blue) to 1 (red). The image also includes a blue arrow indicating the reconstruction process "from 33 ch".
### Components/Axes
* **Heatmaps:** Three heatmaps are arranged horizontally. From left to right, they represent "Ground truth", "PINN", and "NN" data.
* **X-axis (Horizontal):** Labeled "Mic. index", with tick marks at 1, 50, and 100.
* **Y-axis (Vertical):** Labeled "Time (ms)", with tick marks at 0, 10, and 20.
* **Colorbar (Right of each heatmap):** Ranges from -1 (blue) to 1 (red), with intermediate values of -0.5, 0, and 0.5.
* **Text:** "Reconstruction from 33 ch" with a blue arrow pointing from the "Ground truth" heatmap to the "PINN" heatmap.
### Detailed Analysis
**1. Ground Truth Heatmap (Left)**
* **X-axis:** Microphone index ranges from 1 to 100.
* **Y-axis:** Time ranges from 0 to 20 ms.
* **Trend:** A prominent red (high value) arc is visible near the top (around 0-2 ms). Several fainter, diagonal lines are present throughout the heatmap, indicating signal propagation across different microphone indices over time.
* **Data Points:**
* The main arc peaks at approximately Time = 1 ms.
* The diagonal lines vary in intensity, with some appearing stronger around Time = 10-20 ms.
**2. PINN Heatmap (Center)**
* **X-axis:** Microphone index ranges from 1 to 100.
* **Y-axis:** Time ranges from 0 to 20 ms.
* **Trend:** Similar to the "Ground truth" heatmap, a red arc is present at the top. The diagonal lines are also visible, but they appear less defined and slightly weaker in intensity compared to the "Ground truth".
* **Data Points:**
* The main arc peaks at approximately Time = 1 ms, similar to the ground truth.
* The diagonal lines are present but less distinct.
**3. NN Heatmap (Right)**
* **X-axis:** Microphone index ranges from 1 to 100.
* **Y-axis:** Time ranges from 0 to 20 ms.
* **Trend:** The red arc at the top is still visible, but it appears more diffuse and less defined than in the "Ground truth" and "PINN" heatmaps. The diagonal lines are significantly weaker and more fragmented. There is also more noise (random variations in color) throughout the heatmap.
* **Data Points:**
* The main arc is less clear, with a broader peak around Time = 1-2 ms.
* The diagonal lines are barely discernible, indicating a less accurate reconstruction of the signal propagation.
### Key Observations
* The "Ground truth" heatmap shows a clear signal pattern with a distinct arc and diagonal lines.
* The "PINN" heatmap provides a reasonable reconstruction, preserving the main features of the "Ground truth" but with some loss of detail.
* The "NN" heatmap shows the poorest reconstruction, with a diffuse arc, fragmented lines, and increased noise.
### Interpretation
The heatmaps demonstrate the performance of PINN and NN in reconstructing data from 33 channels, compared to the "Ground truth". The PINN method appears to provide a better reconstruction than the NN method, as it preserves more of the key features present in the "Ground truth" data. The NN method suffers from increased noise and a less accurate representation of the signal propagation, suggesting that it may not be as effective for this particular reconstruction task. The blue arrow and text "Reconstruction from 33 ch" suggest that the PINN and NN heatmaps are reconstructions based on a limited number of channels, highlighting the challenge of accurately reconstructing the original signal with incomplete data.