\n
## Heatmap: Reconstruction of Signals from Microphone Arrays
### Overview
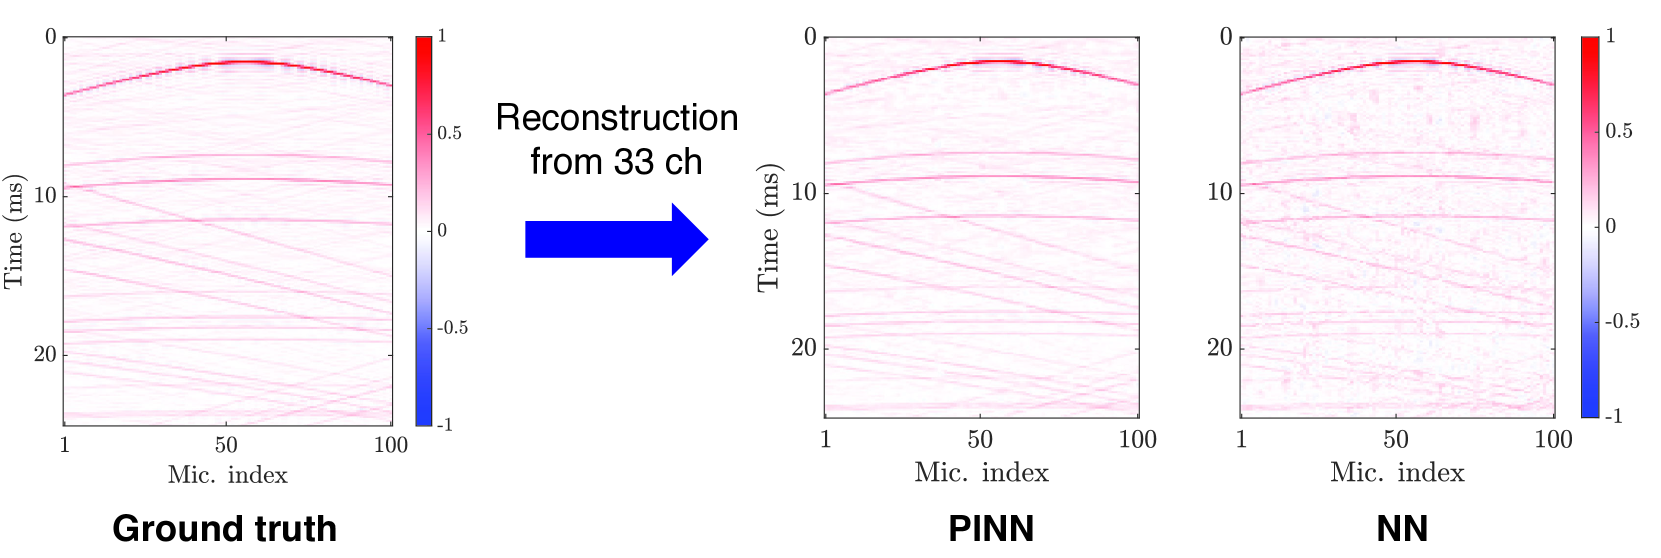
The image presents three heatmaps comparing signal reconstruction quality using different methods: Ground Truth, Physics-Informed Neural Network (PINN), and a standard Neural Network (NN). Each heatmap visualizes the reconstructed signal over time for a 100-microphone array, with the color representing the signal amplitude. A blue arrow indicates the data flow from Ground Truth to PINN.
### Components/Axes
Each heatmap shares the following components:
* **X-axis:** "Mic. index" (Microphone Index), ranging from approximately 1 to 100.
* **Y-axis:** "Time (ms)" (Time in milliseconds), ranging from approximately 0 to 25.
* **Colorbar:** A color scale ranging from -1 to 1, representing the signal amplitude. Red indicates positive values close to 1, blue indicates negative values close to -1, and white/light colors represent values near 0.
* **Labels:** Each heatmap is labeled with the reconstruction method used: "Ground truth", "PINN", and "NN".
### Detailed Analysis
**1. Ground Truth:**
* The heatmap shows a clear, structured pattern of red lines (positive signal) concentrated in the upper portion of the plot. The lines are relatively straight and parallel, indicating a consistent signal across microphones and time.
* The signal amplitude appears to be consistently high (close to 1) across most microphones and time points.
* There is a slight gradient in the signal amplitude, with the upper lines being more intense red.
**2. PINN:**
* The PINN heatmap exhibits a similar pattern to the Ground Truth, but with significantly more noise and distortion. The lines are less defined and more scattered.
* The signal amplitude is less consistent, with more areas showing white/light colors (values near 0).
* The red lines are still present, but they are less concentrated and more diffuse.
* There is a noticeable amount of blue (negative signal) scattered throughout the heatmap, indicating reconstruction errors.
**3. NN:**
* The NN heatmap shows the most significant distortion and noise compared to the Ground Truth and PINN. The lines are highly scattered and fragmented.
* The signal amplitude is highly variable, with large areas of white/light colors and significant amounts of both red and blue.
* The overall structure of the signal is barely discernible, indicating a poor reconstruction quality.
### Key Observations
* The Ground Truth provides a clean and well-defined signal reconstruction.
* PINN demonstrates a reasonable reconstruction, but with noticeable noise and distortion.
* NN exhibits the poorest reconstruction quality, with significant noise and a lack of structure.
* The colorbar consistently ranges from -1 to 1 across all three heatmaps, allowing for a direct comparison of signal amplitudes.
### Interpretation
The data suggests that PINN offers a more accurate signal reconstruction compared to a standard Neural Network when reconstructing signals from a microphone array. While PINN introduces some noise and distortion, it preserves the overall structure of the signal better than the NN. The Ground Truth serves as a benchmark, demonstrating the ideal reconstruction quality. The increased noise in PINN and especially NN indicates that these methods struggle to accurately capture the underlying physics of the signal propagation, leading to reconstruction errors. The presence of blue in the PINN and NN heatmaps suggests that these methods sometimes reconstruct signals with incorrect polarity. The visual comparison highlights the benefits of incorporating physics-based knowledge (as in PINN) into neural network models for signal processing applications. The arrow indicates a process of attempting to approximate the Ground Truth using the PINN method.