## Scatter Plot: SWE-Bench Verified vs. Activated Model Size
### Overview
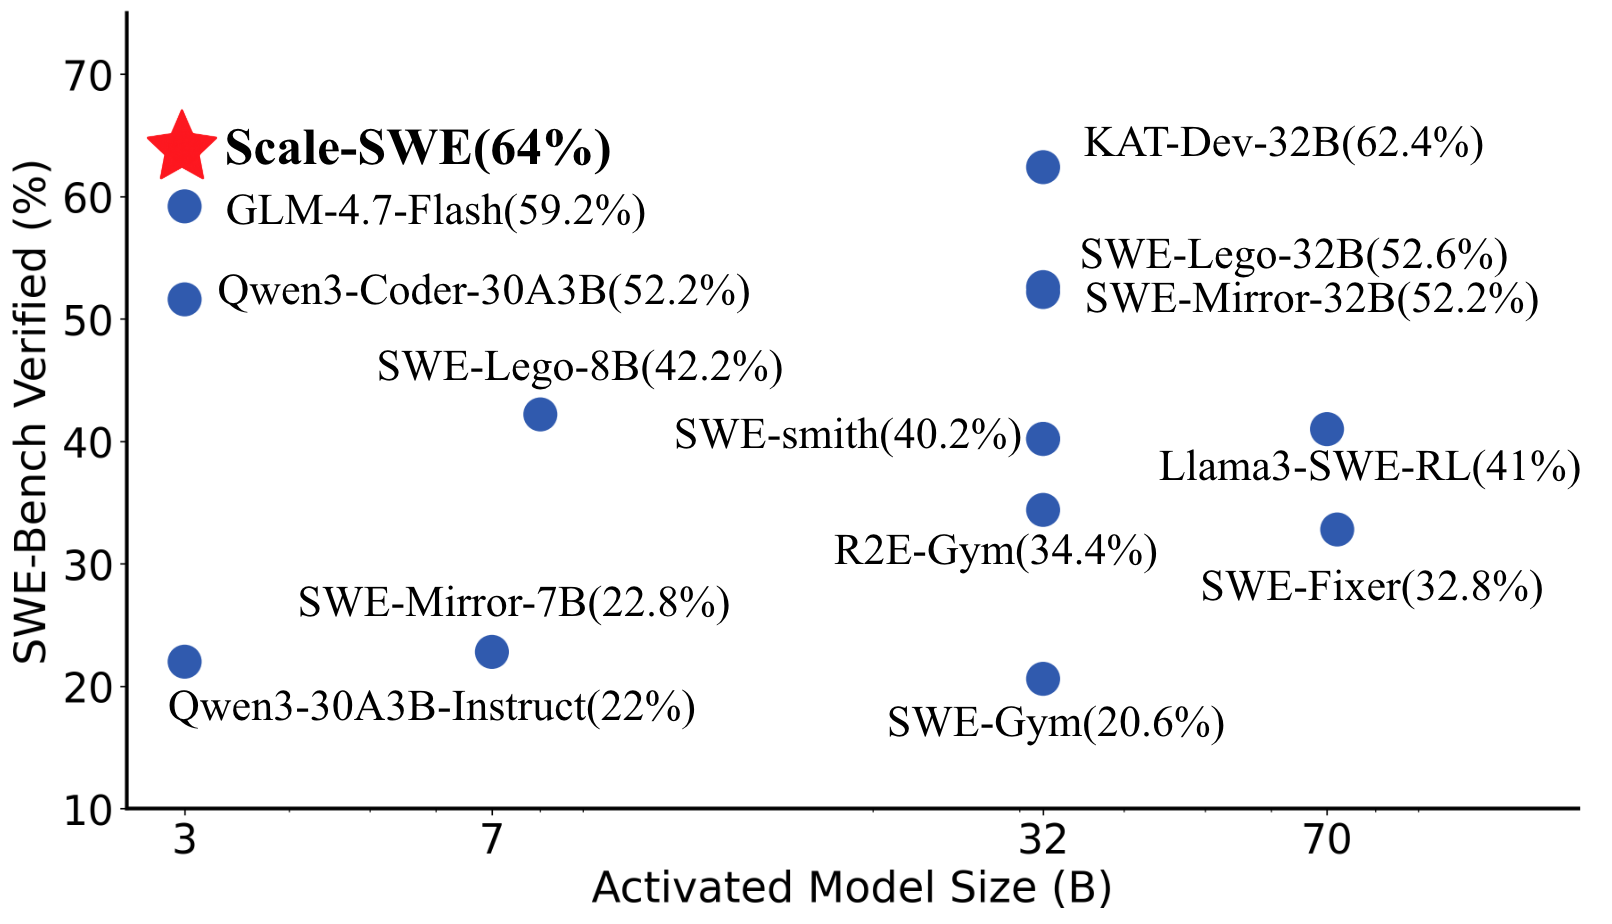
The image is a scatter plot comparing the performance of various language models on the SWE-Bench verification task against their activated model size. The x-axis represents the activated model size in billions of parameters (B), and the y-axis represents the SWE-Bench verified percentage. Each blue dot represents a different model, with its name and performance percentage labeled next to it. A red star highlights the "Scale-SWE" model.
### Components/Axes
* **X-axis:** Activated Model Size (B). The scale is non-linear, with markers at 3, 7, 32, and 70.
* **Y-axis:** SWE-Bench Verified (%). The scale ranges from 10 to 70, with markers at intervals of 10.
* **Data Points:** Each data point is a blue circle, labeled with the model name and its corresponding SWE-Bench verified percentage.
* **Highlighted Point:** The "Scale-SWE" model is marked with a red star.
### Detailed Analysis
Here's a breakdown of the data points, their approximate positions, and the trend they exhibit:
* **Scale-SWE:** (Red Star) Located at approximately (3, 64%). SWE-Bench Verified is 64%.
* **Qwen3-30A3B-Instruct:** Located at approximately (3, 22%). SWE-Bench Verified is 22%.
* **Qwen3-Coder-30A3B:** Located at approximately (3, 52%). SWE-Bench Verified is 52.2%.
* **GLM-4.7-Flash:** Located at approximately (3, 59%). SWE-Bench Verified is 59.2%.
* **SWE-Mirror-7B:** Located at approximately (7, 23%). SWE-Bench Verified is 22.8%.
* **SWE-Lego-8B:** Located at approximately (7, 42%). SWE-Bench Verified is 42.2%.
* **SWE-Gym:** Located at approximately (32, 21%). SWE-Bench Verified is 20.6%.
* **R2E-Gym:** Located at approximately (32, 34%). SWE-Bench Verified is 34.4%.
* **SWE-smith:** Located at approximately (32, 40%). SWE-Bench Verified is 40.2%.
* **Llama3-SWE-RL:** Located at approximately (70, 41%). SWE-Bench Verified is 41%.
* **SWE-Fixer:** Located at approximately (70, 33%). SWE-Bench Verified is 32.8%.
* **KAT-Dev-32B:** Located at approximately (32, 62%). SWE-Bench Verified is 62.4%.
* **SWE-Lego-32B:** Located at approximately (32, 53%). SWE-Bench Verified is 52.6%.
* **SWE-Mirror-32B:** Located at approximately (32, 52%). SWE-Bench Verified is 52.2%.
### Key Observations
* There is a general trend of increasing SWE-Bench verified percentage as the activated model size increases, but this trend is not strictly linear.
* There is a cluster of models around the 32B activated model size, with varying SWE-Bench verified percentages.
* The "Scale-SWE" model has the highest SWE-Bench verified percentage (64%) and is highlighted with a red star.
* The models with the smallest activated model size (3B) have the lowest SWE-Bench verified percentages.
### Interpretation
The scatter plot suggests that, in general, larger language models tend to perform better on the SWE-Bench verification task. However, the performance is not solely determined by model size, as models with similar sizes can have significantly different performance. This indicates that other factors, such as model architecture, training data, and training methods, also play a crucial role in determining the performance on this benchmark. The "Scale-SWE" model stands out as having the best performance, suggesting it may have a particularly effective architecture or training regime for this task. The clustering of models around 32B suggests this may be a common or practical model size.