## Scatter Plot: SWE-Bench Verified (%) vs. Activated Model Size (B)
### Overview
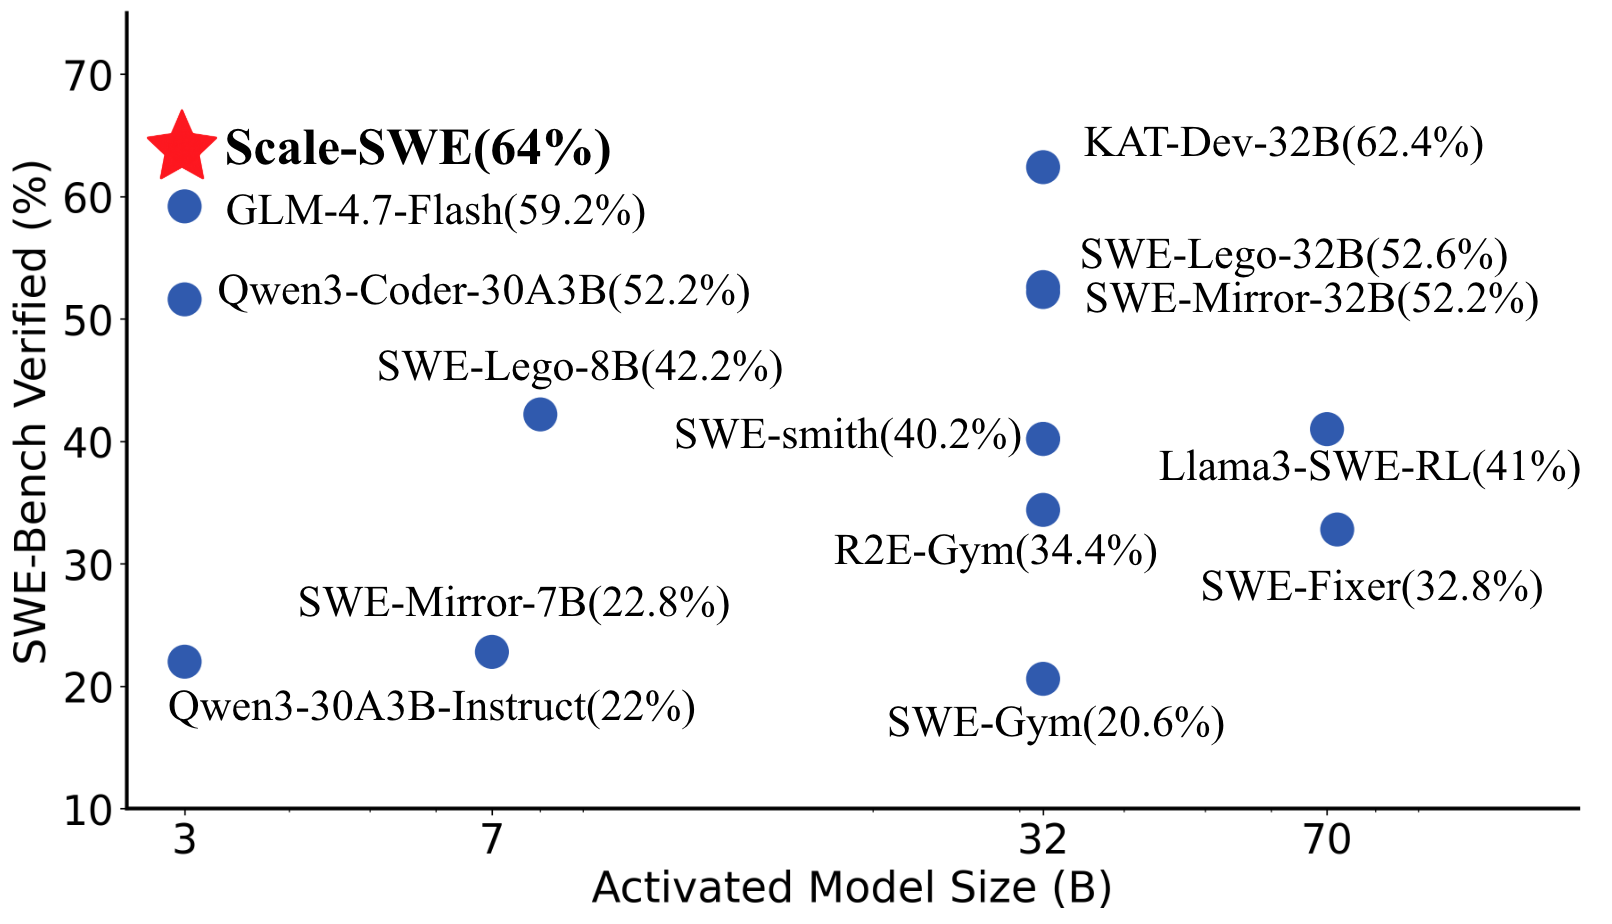
The image is a scatter plot comparing the percentage of SWE-Bench verified results against the activated model size (in billions of parameters). Data points are labeled with model names and their corresponding verification percentages. A red star marks "Scale-SWE(64%)" as the highest-performing model, while blue dots represent other models with varying sizes and verification rates.
### Components/Axes
- **X-axis**: "Activated Model Size (B)" ranging from 3 to 70 (in billions of parameters).
- **Y-axis**: "SWE-Bench Verified (%)" ranging from 10% to 70%.
- **Legend**:
- Red star: **Scale-SWE(64%)** (top-left corner).
- Blue dots: Other models (e.g., GLM-4.7-Flash, Qwen3-Coder-30A3B, etc.).
### Detailed Analysis
- **Model Sizes and Verification Rates**:
- **Scale-SWE(64%)**: Red star at (3B, 64%).
- **KAT-Dev-32B(62.4%)**: Blue dot at (32B, 62.4%).
- **SWE-Lego-32B(52.6%)**: Blue dot at (32B, 52.6%).
- **SWE-Mirror-32B(52.2%)**: Blue dot at (32B, 52.2%).
- **GLM-4.7-Flash(59.2%)**: Blue dot at (7B, 59.2%).
- **Qwen3-Coder-30A3B(52.2%)**: Blue dot at (30A3B, 52.2%).
- **SWE-Lego-8B(42.2%)**: Blue dot at (8B, 42.2%).
- **SWE-Smith(40.2%)**: Blue dot at (32B, 40.2%).
- **R2E-Gym(34.4%)**: Blue dot at (32B, 34.4%).
- **Llama3-SWE-RL(41%)**: Blue dot at (70B, 41%).
- **SWE-Fixer(32.8%)**: Blue dot at (32B, 32.8%).
- **SWE-Gym(20.6%)**: Blue dot at (32B, 20.6%).
- **Qwen3-30A3B-Instruct(22%)**: Blue dot at (30A3B, 22%).
- **SWE-Mirror-7B(22.8%)**: Blue dot at (7B, 22.8%).
### Key Observations
1. **Scale-SWE(64%)** is the highest-performing model, despite being the smallest (3B).
2. **KAT-Dev-32B(62.4%)** is the second-highest, with a larger model size (32B).
3. **Larger models (70B)** like **Llama3-SWE-RL(41%)** and **SWE-Fixer(32.8%)** show lower verification rates compared to mid-sized models.
4. **Mid-sized models (32B)** exhibit a mix of high (e.g., KAT-Dev-32B) and low (e.g., SWE-Gym) performance.
5. **Smaller models (3B–8B)** like **Scale-SWE** and **GLM-4.7-Flash** achieve higher verification rates than some larger models.
### Interpretation
The data suggests that **model size does not directly correlate with SWE-Bench verification performance**. While larger models (e.g., 70B) generally underperform compared to mid-sized models (e.g., 32B), exceptions like **Scale-SWE(64%)** demonstrate that architectural efficiency or optimization can outweigh size. The presence of high-performing smaller models (e.g., **GLM-4.7-Flash(59.2%)**) highlights the importance of model design over sheer scale. This implies that **verification efficiency** may depend on factors like training data quality, task-specific tuning, or algorithmic innovation rather than just parameter count.