## Bar Chart: Model Performance Comparison (Generation vs. Multiple-choice)
### Overview
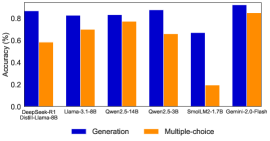
The image displays a grouped bar chart comparing the performance of six different language models on two distinct task types: "Generation" and "Multiple-choice." The performance is measured as a percentage, likely representing accuracy or a similar success metric. The chart uses a dark background with blue and orange bars for clear contrast.
### Components/Axes
* **Chart Type:** Grouped bar chart.
* **Title:** Not explicitly stated in the image. The chart's purpose is inferred from its content.
* **Y-Axis:**
* **Label:** "Percentage (%)"
* **Scale:** Linear scale from 0.0 to 1.0 (representing 0% to 100%).
* **Markers:** 0.0, 0.2, 0.4, 0.6, 0.8, 1.0.
* **X-Axis:**
* **Label:** Not explicitly labeled, but contains categorical model names.
* **Categories (from left to right):**
1. `Qwen2.5-72B`
2. `Llama-3.1-405B`
3. `Qwen2-72B`
4. `Qwen2-7B`
5. `Small-1.7B`
6. `Qwen2-5-72B`
* **Legend:**
* **Position:** Bottom center of the chart area.
* **Items:**
* **Blue Square:** "Generation"
* **Orange Square:** "Multiple-choice"
### Detailed Analysis
The chart presents performance data for six models across two tasks. Below is an extraction of the approximate values for each bar, based on visual alignment with the y-axis grid lines.
| Model Name | Generation (Blue Bar) | Multiple-choice (Orange Bar) |
| :--- | :--- | :--- |
| **Qwen2.5-72B** | ~0.95 (95%) | ~0.60 (60%) |
| **Llama-3.1-405B** | ~0.85 (85%) | ~0.80 (80%) |
| **Qwen2-72B** | ~0.85 (85%) | ~0.80 (80%) |
| **Qwen2-7B** | ~0.95 (95%) | ~0.80 (80%) |
| **Small-1.7B** | ~0.75 (75%) | ~0.20 (20%) |
| **Qwen2-5-72B** | ~0.95 (95%) | ~0.85 (85%) |
**Trend Verification per Data Series:**
* **Generation (Blue Bars):** The performance is consistently high across all models, with most scoring between 85% and 95%. The `Small-1.7B` model is the lowest performer in this category at approximately 75%. The trend is one of generally strong performance with a single notable dip.
* **Multiple-choice (Orange Bars):** Performance varies significantly more. It ranges from a low of ~20% (`Small-1.7B`) to a high of ~85% (`Qwen2-5-72B`). There is no uniform trend; performance is model-dependent.
### Key Observations
1. **Performance Gap:** A significant performance gap exists between the two tasks for the `Qwen2.5-72B` model (95% vs. 60%) and the `Small-1.7B` model (75% vs. 20%).
2. **Model Consistency:** The `Llama-3.1-405B` and `Qwen2-72B` models show the most balanced performance, with less than a 5% difference between their Generation and Multiple-choice scores.
3. **Outlier:** The `Small-1.7B` model is a clear outlier, showing the lowest performance in both categories, with a particularly drastic drop in Multiple-choice capability.
4. **Top Performer:** The `Qwen2-5-72B` model appears to be the top overall performer, achieving the highest score in Multiple-choice (~85%) while maintaining a top-tier Generation score (~95%).
5. **Task Difficulty:** For most models shown, the "Generation" task appears to be easier (yielding higher scores) than the "Multiple-choice" task, with the exception of the balanced `Llama-3.1-405B` and `Qwen2-72B`.
### Interpretation
This chart suggests that the evaluated language models possess significantly different strengths. The "Generation" task, which likely involves open-ended text creation, appears to be a more consistent strength across models of varying sizes (from 1.7B to 72B+ parameters). In contrast, "Multiple-choice" performance, which may require precise knowledge retrieval or reasoning within constrained options, is more volatile and model-specific.
The data implies that model size alone (e.g., 72B parameters) does not guarantee superior performance on all task types, as seen with `Qwen2.5-72B`'s lower Multiple-choice score. Conversely, the `Small-1.7B` model's poor performance, especially on Multiple-choice, highlights potential limitations in smaller models for tasks requiring precise factual recall or complex discrimination.
The most notable finding is the existence of models like `Qwen2-5-72B` and `Qwen2-7B` that achieve high scores in both categories, suggesting a more robust and versatile architecture or training regimen. This comparison is crucial for selecting the right model for a specific application: a model excelling in Generation may be preferred for creative writing assistants, while one with balanced or superior Multiple-choice performance might be better suited for QA systems or exam engines.