## Line Chart: Accuracy vs. Attack Ratio for Different Federated Learning Algorithms
### Overview
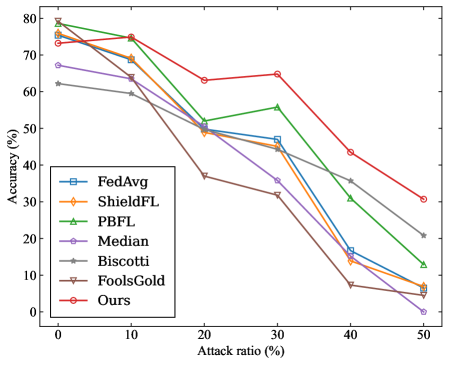
The image is a line chart comparing the accuracy of different federated learning algorithms as the attack ratio increases. The x-axis represents the attack ratio (percentage), and the y-axis represents the accuracy (percentage). Seven different algorithms are compared: FedAvg, ShieldFL, PBFL, Median, Biscotti, FoolsGold, and Ours.
### Components/Axes
* **X-axis:** Attack ratio (%), with markers at 0, 10, 20, 30, 40, and 50.
* **Y-axis:** Accuracy (%), with markers at 0, 10, 20, 30, 40, 50, 60, 70, and 80.
* **Legend:** Located on the right side of the chart, listing the algorithms and their corresponding line colors and markers:
* FedAvg (blue, square marker)
* ShieldFL (orange, diamond marker)
* PBFL (green, triangle marker)
* Median (purple, pentagon marker)
* Biscotti (gray, star marker)
* FoolsGold (brown, inverted triangle marker)
* Ours (red, circle marker)
### Detailed Analysis
* **FedAvg (blue, square marker):** The accuracy starts at approximately 74% at 0% attack ratio and decreases to approximately 47% at 30% attack ratio, then further decreases to approximately 10% at 50% attack ratio.
* **ShieldFL (orange, diamond marker):** The accuracy starts at approximately 78% at 0% attack ratio and decreases to approximately 46% at 30% attack ratio, then further decreases to approximately 7% at 50% attack ratio.
* **PBFL (green, triangle marker):** The accuracy starts at approximately 79% at 0% attack ratio and decreases to approximately 56% at 30% attack ratio, then further decreases to approximately 6% at 50% attack ratio.
* **Median (purple, pentagon marker):** The accuracy starts at approximately 67% at 0% attack ratio and decreases to approximately 47% at 30% attack ratio, then further decreases to approximately 5% at 50% attack ratio.
* **Biscotti (gray, star marker):** The accuracy starts at approximately 62% at 0% attack ratio and decreases to approximately 42% at 30% attack ratio, then further decreases to approximately 21% at 50% attack ratio.
* **FoolsGold (brown, inverted triangle marker):** The accuracy starts at approximately 79% at 0% attack ratio and decreases to approximately 32% at 30% attack ratio, then further decreases to approximately 4% at 50% attack ratio.
* **Ours (red, circle marker):** The accuracy starts at approximately 75% at 0% attack ratio, decreases to approximately 65% at 30% attack ratio, then decreases to approximately 31% at 50% attack ratio.
### Key Observations
* All algorithms experience a decrease in accuracy as the attack ratio increases.
* The "Ours" algorithm (red line) consistently maintains a higher accuracy compared to the other algorithms, especially at higher attack ratios.
* FoolsGold, ShieldFL, and Median algorithms show the most significant drop in accuracy as the attack ratio increases.
### Interpretation
The chart demonstrates the impact of increasing attack ratios on the accuracy of various federated learning algorithms. The "Ours" algorithm appears to be more robust to attacks compared to the other algorithms tested, as it maintains a higher accuracy even at higher attack ratios. This suggests that the "Ours" algorithm may incorporate some form of defense mechanism against adversarial attacks. The other algorithms are more susceptible to attacks, as their accuracy drops significantly with increasing attack ratios. The data highlights the importance of developing robust federated learning algorithms that can withstand adversarial attacks to ensure reliable performance in real-world scenarios.