## Line Chart: Federated Learning Method Accuracy vs. Attack Ratio
### Overview
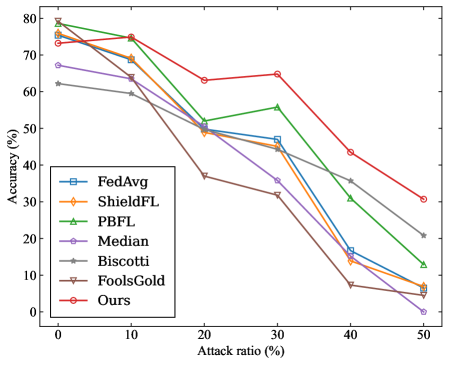
This image is a line chart comparing the performance of seven different federated learning methods or aggregation strategies. The chart plots the model accuracy (in percentage) against an increasing "Attack ratio" (in percentage), which likely represents the proportion of malicious or adversarial participants in the federated learning system. The chart demonstrates how each method's accuracy degrades as the system comes under a stronger attack.
### Components/Axes
* **Chart Type:** Multi-line chart with markers.
* **X-Axis:** Labeled **"Attack ratio (%)"**. The axis has major tick marks at 0, 10, 20, 30, 40, and 50.
* **Y-Axis:** Labeled **"Accuracy (%)"**. The axis has major tick marks at 0, 10, 20, 30, 40, 50, 60, 70, and 80.
* **Legend:** Located in the **center-left** portion of the chart area. It lists seven data series with corresponding colors and marker symbols:
1. **FedAvg** - Blue line with square markers (□).
2. **ShieldFL** - Orange line with diamond markers (◇).
3. **PBFL** - Green line with upward-pointing triangle markers (△).
4. **Median** - Purple line with circle markers (○).
5. **Biscotti** - Gray line with asterisk markers (*).
6. **FoolsGold** - Brown line with downward-pointing triangle markers (▽).
7. **Ours** - Red line with pentagram markers (☆).
### Detailed Analysis
The following table reconstructs the approximate data points for each method at the given attack ratios. Values are estimated from the chart's grid lines and marker positions. **Uncertainty is ±2-3% for most points due to visual estimation.**
| Attack Ratio (%) | FedAvg (Blue, □) | ShieldFL (Orange, ◇) | PBFL (Green, △) | Median (Purple, ○) | Biscotti (Gray, *) | FoolsGold (Brown, ▽) | Ours (Red, ☆) |
| :--- | :--- | :--- | :--- | :--- | :--- | :--- | :--- |
| **0** | ~75% | ~74% | ~79% | ~67% | ~62% | ~75% | ~74% |
| **10** | ~69% | ~68% | ~75% | ~63% | ~58% | ~63% | ~75% |
| **20** | ~51% | ~49% | ~51% | ~50% | ~50% | ~37% | ~63% |
| **30** | ~46% | ~45% | ~56% | ~36% | ~32% | ~32% | ~65% |
| **40** | ~16% | ~14% | ~31% | ~15% | ~36% | ~7% | ~43% |
| **50** | ~6% | ~5% | ~13% | ~0% | ~21% | ~4% | ~31% |
**Trend Verification per Data Series:**
* **FedAvg (Blue):** Starts high (~75%), declines steadily and sharply after 20% attack ratio, ending very low (~6%).
* **ShieldFL (Orange):** Follows a nearly identical trend to FedAvg, starting slightly lower and ending at a similar low point (~5%).
* **PBFL (Green):** Starts the highest (~79%), maintains a lead until 30%, then declines but remains more resilient than FedAvg/ShieldFL, ending at ~13%.
* **Median (Purple):** Starts moderately (~67%), declines consistently, and suffers a catastrophic drop to near 0% at 50% attack ratio.
* **Biscotti (Gray):** Starts the lowest (~62%), shows a unique trend by dipping at 30% but then *increasing* at 40% before falling again. It is the second-best performer at 50% (~21%).
* **FoolsGold (Brown):** Starts high (~75%), experiences the most severe and early drop, plummeting to ~37% at 20% attack ratio and ending among the worst (~4%).
* **Ours (Red):** Starts high (~74%), maintains or even slightly increases accuracy up to 30% attack ratio (~65%), then declines but remains the top performer at all points from 20% onward, finishing at ~31%.
### Key Observations
1. **Universal Degradation:** All methods show a decrease in accuracy as the attack ratio increases from 0% to 50%.
2. **Performance Tiers at High Attack (50%):**
* **Top Tier:** "Ours" (~31%) is the clear leader.
* **Middle Tier:** Biscotti (~21%) and PBFL (~13%) show moderate resilience.
* **Low Tier:** FedAvg, ShieldFL, Median, and FoolsGold all collapse to ≤6% accuracy.
3. **Critical Threshold:** A significant performance drop for most methods occurs between the 20% and 40% attack ratio marks.
4. **Anomaly - Biscotti's Mid-Attack Resilience:** The Biscotti method is the only one that does not follow a strictly monotonic decrease; its accuracy at 40% attack (~36%) is higher than at 30% (~32%).
5. **Anomaly - "Ours" at 30%:** The proposed method ("Ours") shows a slight accuracy *increase* from 20% (~63%) to 30% (~65%), suggesting potential robustness or a specific response to that level of adversarial presence.
### Interpretation
This chart is a robustness evaluation of federated learning aggregation algorithms under poisoning or Byzantine attacks. The "Attack ratio" represents the fraction of malicious clients sending corrupted model updates.
* **The data suggests** that the proposed method ("Ours") is significantly more robust to adversarial attacks than the six baseline methods compared. Its performance advantage becomes pronounced once the attack ratio exceeds 10-20%.
* **The elements relate** to show a clear hierarchy of resilience. Traditional methods like FedAvg and its variant ShieldFL are highly vulnerable. Median and FoolsGold, often used for robustness, also fail catastrophically at high attack ratios. PBFL and Biscotti offer intermediate levels of protection.
* **Notable trends** include the early collapse of FoolsGold and the non-linear, somewhat resilient response of Biscotti. The most important anomaly is the sustained high performance of "Ours" up to a 30% attack ratio, which is a critical threshold where most other systems fail. This indicates the proposed method likely employs a more sophisticated mechanism for identifying and neutralizing malicious updates without discarding useful information from benign clients. The chart's primary message is the superior security-utility trade-off achieved by the authors' approach.