## Line Graph: Accuracy vs. Attack Ratio
### Overview
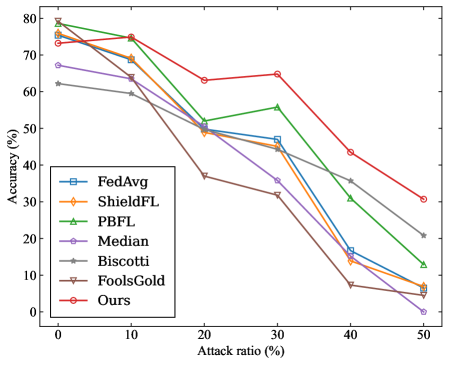
The graph compares the accuracy (%) of seven different methods (FedAvg, ShieldFL, PBFL, Median, Biscotti, FoolsGold, Ours) as the attack ratio (%) increases from 0 to 50. All methods start with high accuracy at 0% attack ratio but degrade as the attack ratio increases, with varying rates of decline.
### Components/Axes
- **Y-axis**: Accuracy (%) ranging from 0 to 80.
- **X-axis**: Attack ratio (%) ranging from 0 to 50.
- **Legend**: Located on the left, associating colors and markers with methods:
- **FedAvg**: Blue squares (■)
- **ShieldFL**: Orange diamonds (◇)
- **PBFL**: Green triangles (△)
- **Median**: Purple pentagons (⬤)
- **Biscotti**: Gray stars (★)
- **FoolsGold**: Brown inverted triangles (▼)
- **Ours**: Red circles (●)
### Detailed Analysis
1. **Ours (Red circles)**: Starts near 75% accuracy at 0% attack ratio, declines gradually to ~30% at 50% attack ratio. Maintains the highest accuracy across most attack ratios.
2. **ShieldFL (Orange diamonds)**: Begins at ~70% accuracy, drops sharply to ~10% by 50% attack ratio. Steepest decline among all methods.
3. **PBFL (Green triangles)**: Starts at ~75%, declines moderately to ~15% at 50% attack ratio. Slightly outperforms Biscotti at higher attack ratios.
4. **Median (Purple pentagons)**: Begins at ~65%, plummets to near 0% by 50% attack ratio. Most drastic drop.
5. **Biscotti (Gray stars)**: Starts at ~60%, declines steadily to ~20% at 50% attack ratio. Linear degradation.
6. **FoolsGold (Brown inverted triangles)**: Starts at ~70%, drops rapidly to ~5% by 50% attack ratio. Second-steepest decline after ShieldFL.
7. **FedAvg (Blue squares)**: Begins at ~70%, declines moderately to ~10% at 50% attack ratio. Similar trend to PBFL but slightly worse at higher attack ratios.
### Key Observations
- **Crossing Lines**: Lines intersect at multiple points (e.g., FedAvg and PBFL cross near 20% attack ratio), indicating no single method dominates across all attack ratios.
- **Outliers**: "Median" and "FoolsGold" exhibit the most severe degradation, while "Ours" and "PBFL" retain higher accuracy longer.
- **Gradual vs. Sharp Declines**: Methods like "Ours" and "Biscotti" show gradual declines, whereas "ShieldFL" and "FoolsGold" drop sharply.
### Interpretation
The data suggests that **Ours** is the most robust method against adversarial attacks, maintaining higher accuracy even at 50% attack ratio. In contrast, **Median** and **FoolsGold** are highly vulnerable, with accuracy collapsing under moderate attack ratios. The graph highlights a trade-off between initial accuracy and robustness: methods with higher starting accuracy (e.g., PBFL, Ours) degrade more slowly, while others (e.g., ShieldFL, Median) sacrifice accuracy rapidly. The crossing lines imply that the optimal method depends on the expected attack ratio, emphasizing the need for context-aware system design.